Samuel Margolis1,2, Paul Schmiedmayer3, Alan Huang1,2, Ethan Chen4, Ishan Bhattacharjee1, Atman Shah4, Ben Viggiano1,2, Fang Cao1,2, Shriya Reddy1,2, Roger Xia1,2, Jack O’Sullivan1,2, Daniel Katz2,3, Matthew Wheeler1,2, Euan Ashley1,2, Bruna Gomes†1,2
1Department of Biomedical Data Science, Stanford University, Stanford, CA 94305, USA
2Department of Medicine, Stanford University, Stanford, CA 94305, USA
3Division of Computational Medicine, Department of Medicine, Stanford University, Stanford, CA 94305, USA
4Brown University, Providence, RI 02912, USA
†Corresponding author: Bruna Gomes.
Abstract
Drug target discovery requires distinguishing molecules that causally drive disease from the many that are merely associated with it, and on determining the direction of modulation expected to improve disease. Artificial intelligence (AI) agents capable of writing and executing code may increasingly automate portions of this workflow; however, training and evaluating such agents to perform target discovery end-to-end requires access to known ground truth targets. Real world biobanks cannot provide such ground truth, as causal relationships remain incompletely characterized and nominated targets require experimental validation. Furthermore, access controls on participant-level data impede large-scale training. DrugTargetWorld addresses these challenges by procedurally generating simulated biobanks, or 'worlds,' each containing genotypes, proteins, health records, and outcomes for 54,000 participants, including 10,800 with synthetic magnetic resonance imaging (MRI) data. The present study instantiates this framework in cardiovascular disease while the underlying world generation framework is designed to support other disease domains. Each world is governed by a concealed causal model that specifies the ground truth, including causal driver proteins for a disease, and non-causal proteins that appear causal due to biases such as confounding. Agents are tasked with constructing a disease phenotype from raw images or other released data, identifying which proteins causally drive disease and inferring the beneficial direction of modulation for each causal driver with the option to conduct virtual ‘wet lab’ experiments. Across 540 episodes, Opus 5 and GPT-5.6 Sol led nine agents on a 100 point composite score spanning target identification, causal confidence, intervention direction, bias identification and disease measurement, scoring 39.98 and 35.38, respectively. Both recovered 64% of causal drivers on average, but no agent reliably distinguished misleading non-causal proteins; Opus 5’s advantage over GPT-5.6 Sol arose mainly from how well it measured disease from the raw data (7.2 versus 3.2 of 10 points). These findings suggest that leading agents can perform most individual analyses required in biobank studies but do not yet consistently make the integrative judgments needed to connect these analyses, namely how to measure disease, distinguish causal drivers from non-causal proteins, and determine when evidence is sufficient to support a claim. By making the causal structure of every world known but hidden from the agent, DrugTargetWorld turns end to end drug target discovery into a scalable, training problem in which research strategies can be evaluated against causal truth and improved through verifiable reward.
1. Introduction
Identifying drug targets remains a difficult part of drug development (Pun et al., 2026) . Human genetic evidence can make this step more reliable, and population biobanks now link genetic data with health records and outcomes for hundreds of thousands of individuals (Bycroft et al., 2018) . For example, family and population studies identified PCSK9 as a target for lowering low-density lipoprotein cholesterol, and variants that reduce its activity anticipated the cardiovascular benefit of its inhibition before outcome trials were reported (Abifadel et al., 2003; Cohen et al., 2006; Ference et al., 2016) . More broadly, drug mechanisms with genetic support are 2.6 times as likely as those without to progress from phase I to launch (Minikel et al., 2024) , and plasma proteomics now extends such evidence to thousands of circulating proteins (Sun et al., 2023) .
Within biobank-based target discovery, recent studies have used Mendelian randomization, colocalization, and cross-phenotype analysis to move from protein-disease associations to genetically supported drug targets (Henry et al., 2022; Lind et al., 2024; Rasooly et al., 2023, 2025; Reddy et al., 2025; Zheng et al., 2020) . These analyses test whether a circulating protein causally affects a disease phenotype, which must first be defined. Which measurements to extract from raw imaging, health records, and outcomes, and how to combine them into a participant-level phenotype, are scientific decisions that can change what genetic analyses discover (An et al., 2023; Gomes et al., 2024) . We call this step phenotype construction, meaning the selection and combination of available measurements into a participant-level representation of disease; it is broader than assigning a disease label from health records. Like the causal analyses that follow, it still relies heavily on human investigators.
In parallel, artificial intelligence (AI) systems built on language models and trained with reinforcement learning have advanced rapidly in mathematical reasoning, formal proof, and software engineering (Guo et al., 2025; Hubert et al., 2026; Jimenez et al., 2024) . AI agents (hereafter, agents), which are language-model systems that write and run code to carry out multi-step tasks, have begun to contribute to mathematical research, including a proof that the forced three-dimensional Navier–Stokes equations can develop a singularity in finite time, formalized in the Lean proof assistant but not yet peer-reviewed (OpenAI, 2026) . Many of these advances rely on a verifiable reward, an automatic check of whether an output is correct, which can both evaluate and train agents (Wen et al., 2025) , as training environments for software-engineering agents illustrate (Pan et al., 2025) .
Agents are also increasingly applied to science, where recent benchmarks and agent systems address data analysis, genetic analysis, and the reproduction of published studies (Chen, 2025; Koch, 2026; Li & Ho, 2026; Mitchener et al., 2025; Xu et al., 2025) . Kosmos, for example, runs extended cycles of data analysis and literature search (Mitchener et al., 2025b). In drug discovery, the Virtual Biotech organizes agents into the divisions of a drug-development company, and more than 37,000 of its agents annotated the outcomes of 55,984 clinical trials (Zhang et al., 2026) . Biomni, an agent that executes diverse biomedical research tasks (Huang et al., 2026) , now underpins a commercial tool for target prioritization (Phylo, 2026), and Aviary has shown that agents improve through repeated training in a scientific environment (Narayanan et al., 2024) . However, these benchmarks typically specify the research question, and neither they nor such systems can be scored against causal ground truth on real data. Because many of these systems also draw on published literature and curated databases, it is difficult to determine whether their conclusions come from the data or from existing knowledge. New targets, by contrast, require primary data in which the answer is not yet published, and single-cell atlases, perturbation screens, and population biobanks each supply only part of that evidence. We focus on population biobanks, which link genetic variation to clinical outcomes in the same individuals.
In real biobanks, however, drug target discovery lacks such a verifiable reward. Open Targets and Perturb-seq screens provide substantial evidence for many proteins (Ochoa et al., 2023; Replogle et al., 2022) , but for most proteins they leave open whether modulation affects disease in patients. The causal links between proteins and a disease phenotype therefore remain only partially known, and the link between a measurable phenotype and the disease mechanism is often even less certain. An agent's nomination of a causal driver and its intervention direction thus requires experimental validation, since even compelling observational evidence can reflect confounding, reverse causation, selection bias, pleiotropy, or measurement artifacts (Leek et al., 2010; Munafò et al., 2018; Sanderson et al., 2022) . Access is a further obstacle, because participant-level biobank data are released under controlled-access agreements and analyzed within approved computing environments, which hinders the repeated, large-scale interaction that training an agent requires. Causal discovery benchmarks do supply known ground truth (Chen et al., 2026; Leban & Sun, 2026; J. Yang et al., 2026) , but their variables are predefined, so agents neither construct a phenotype from raw data nor search among thousands of candidate proteins.
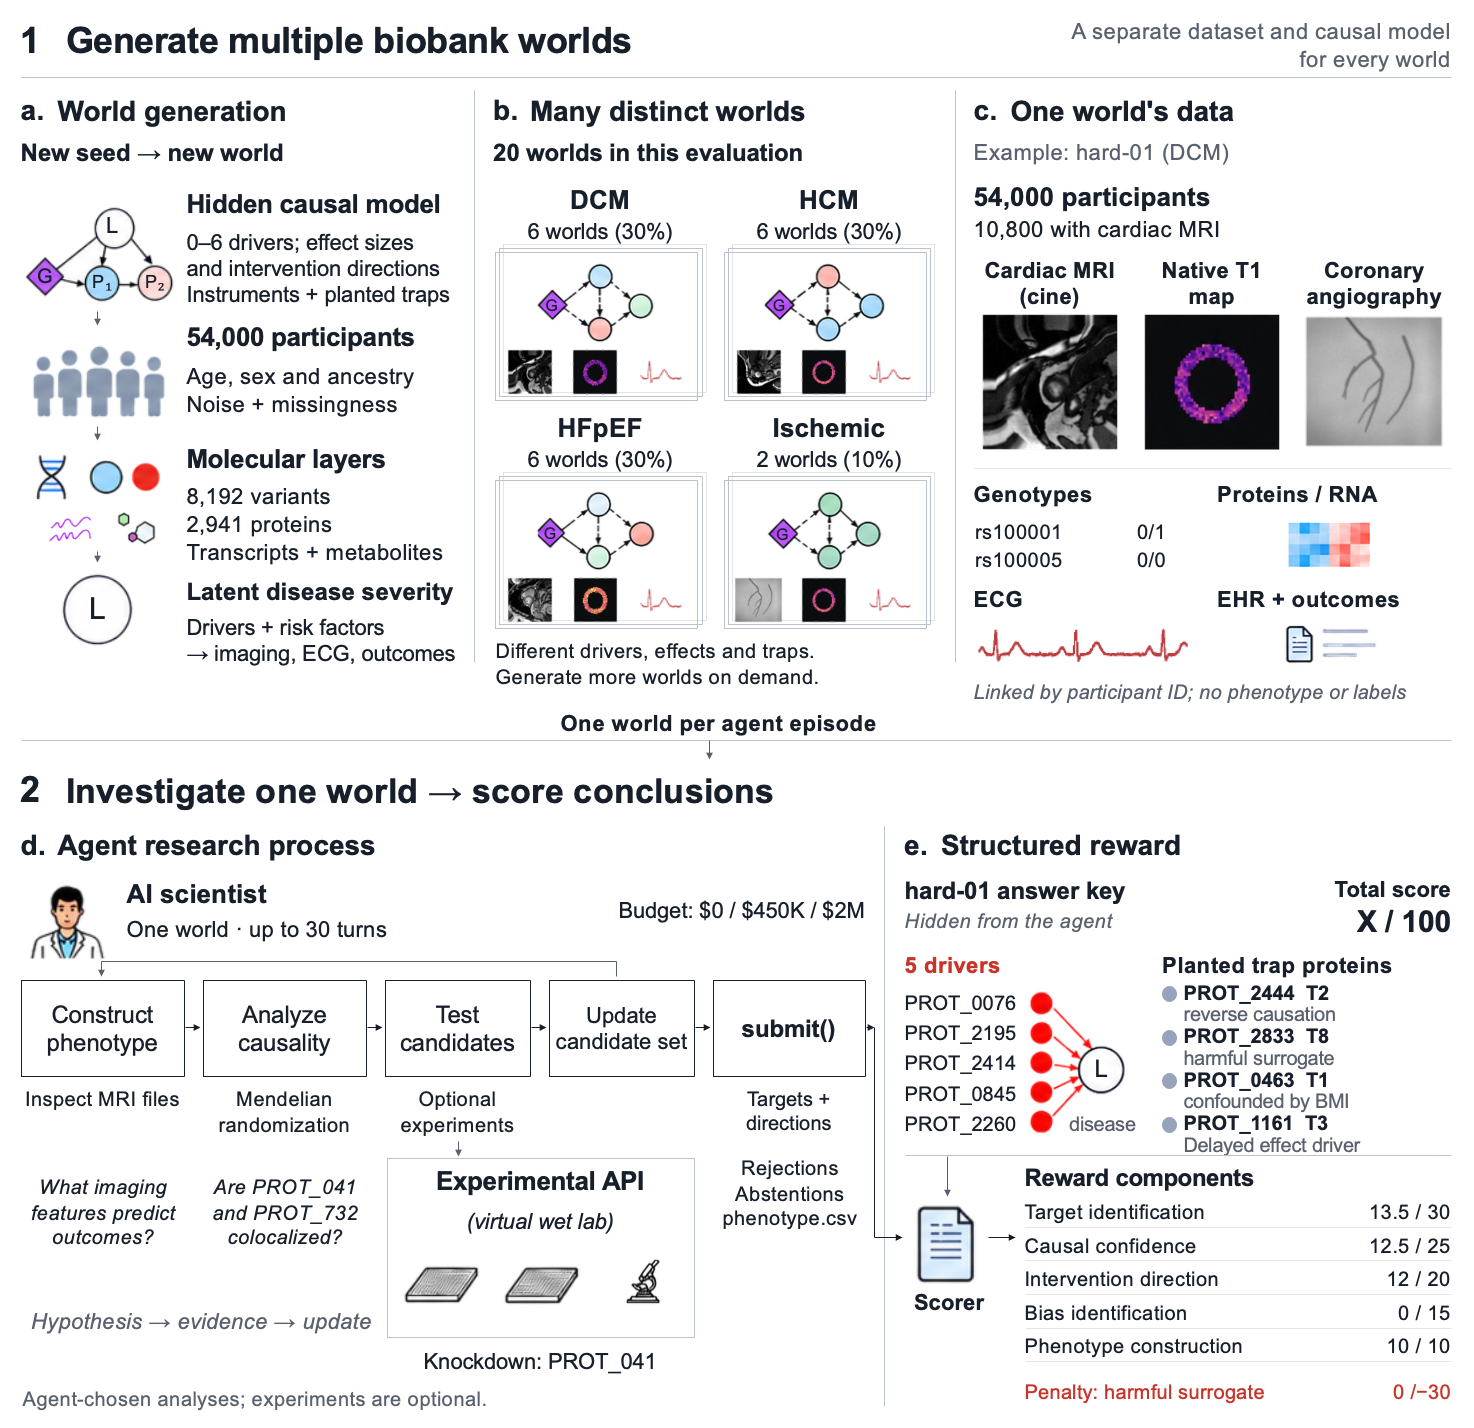
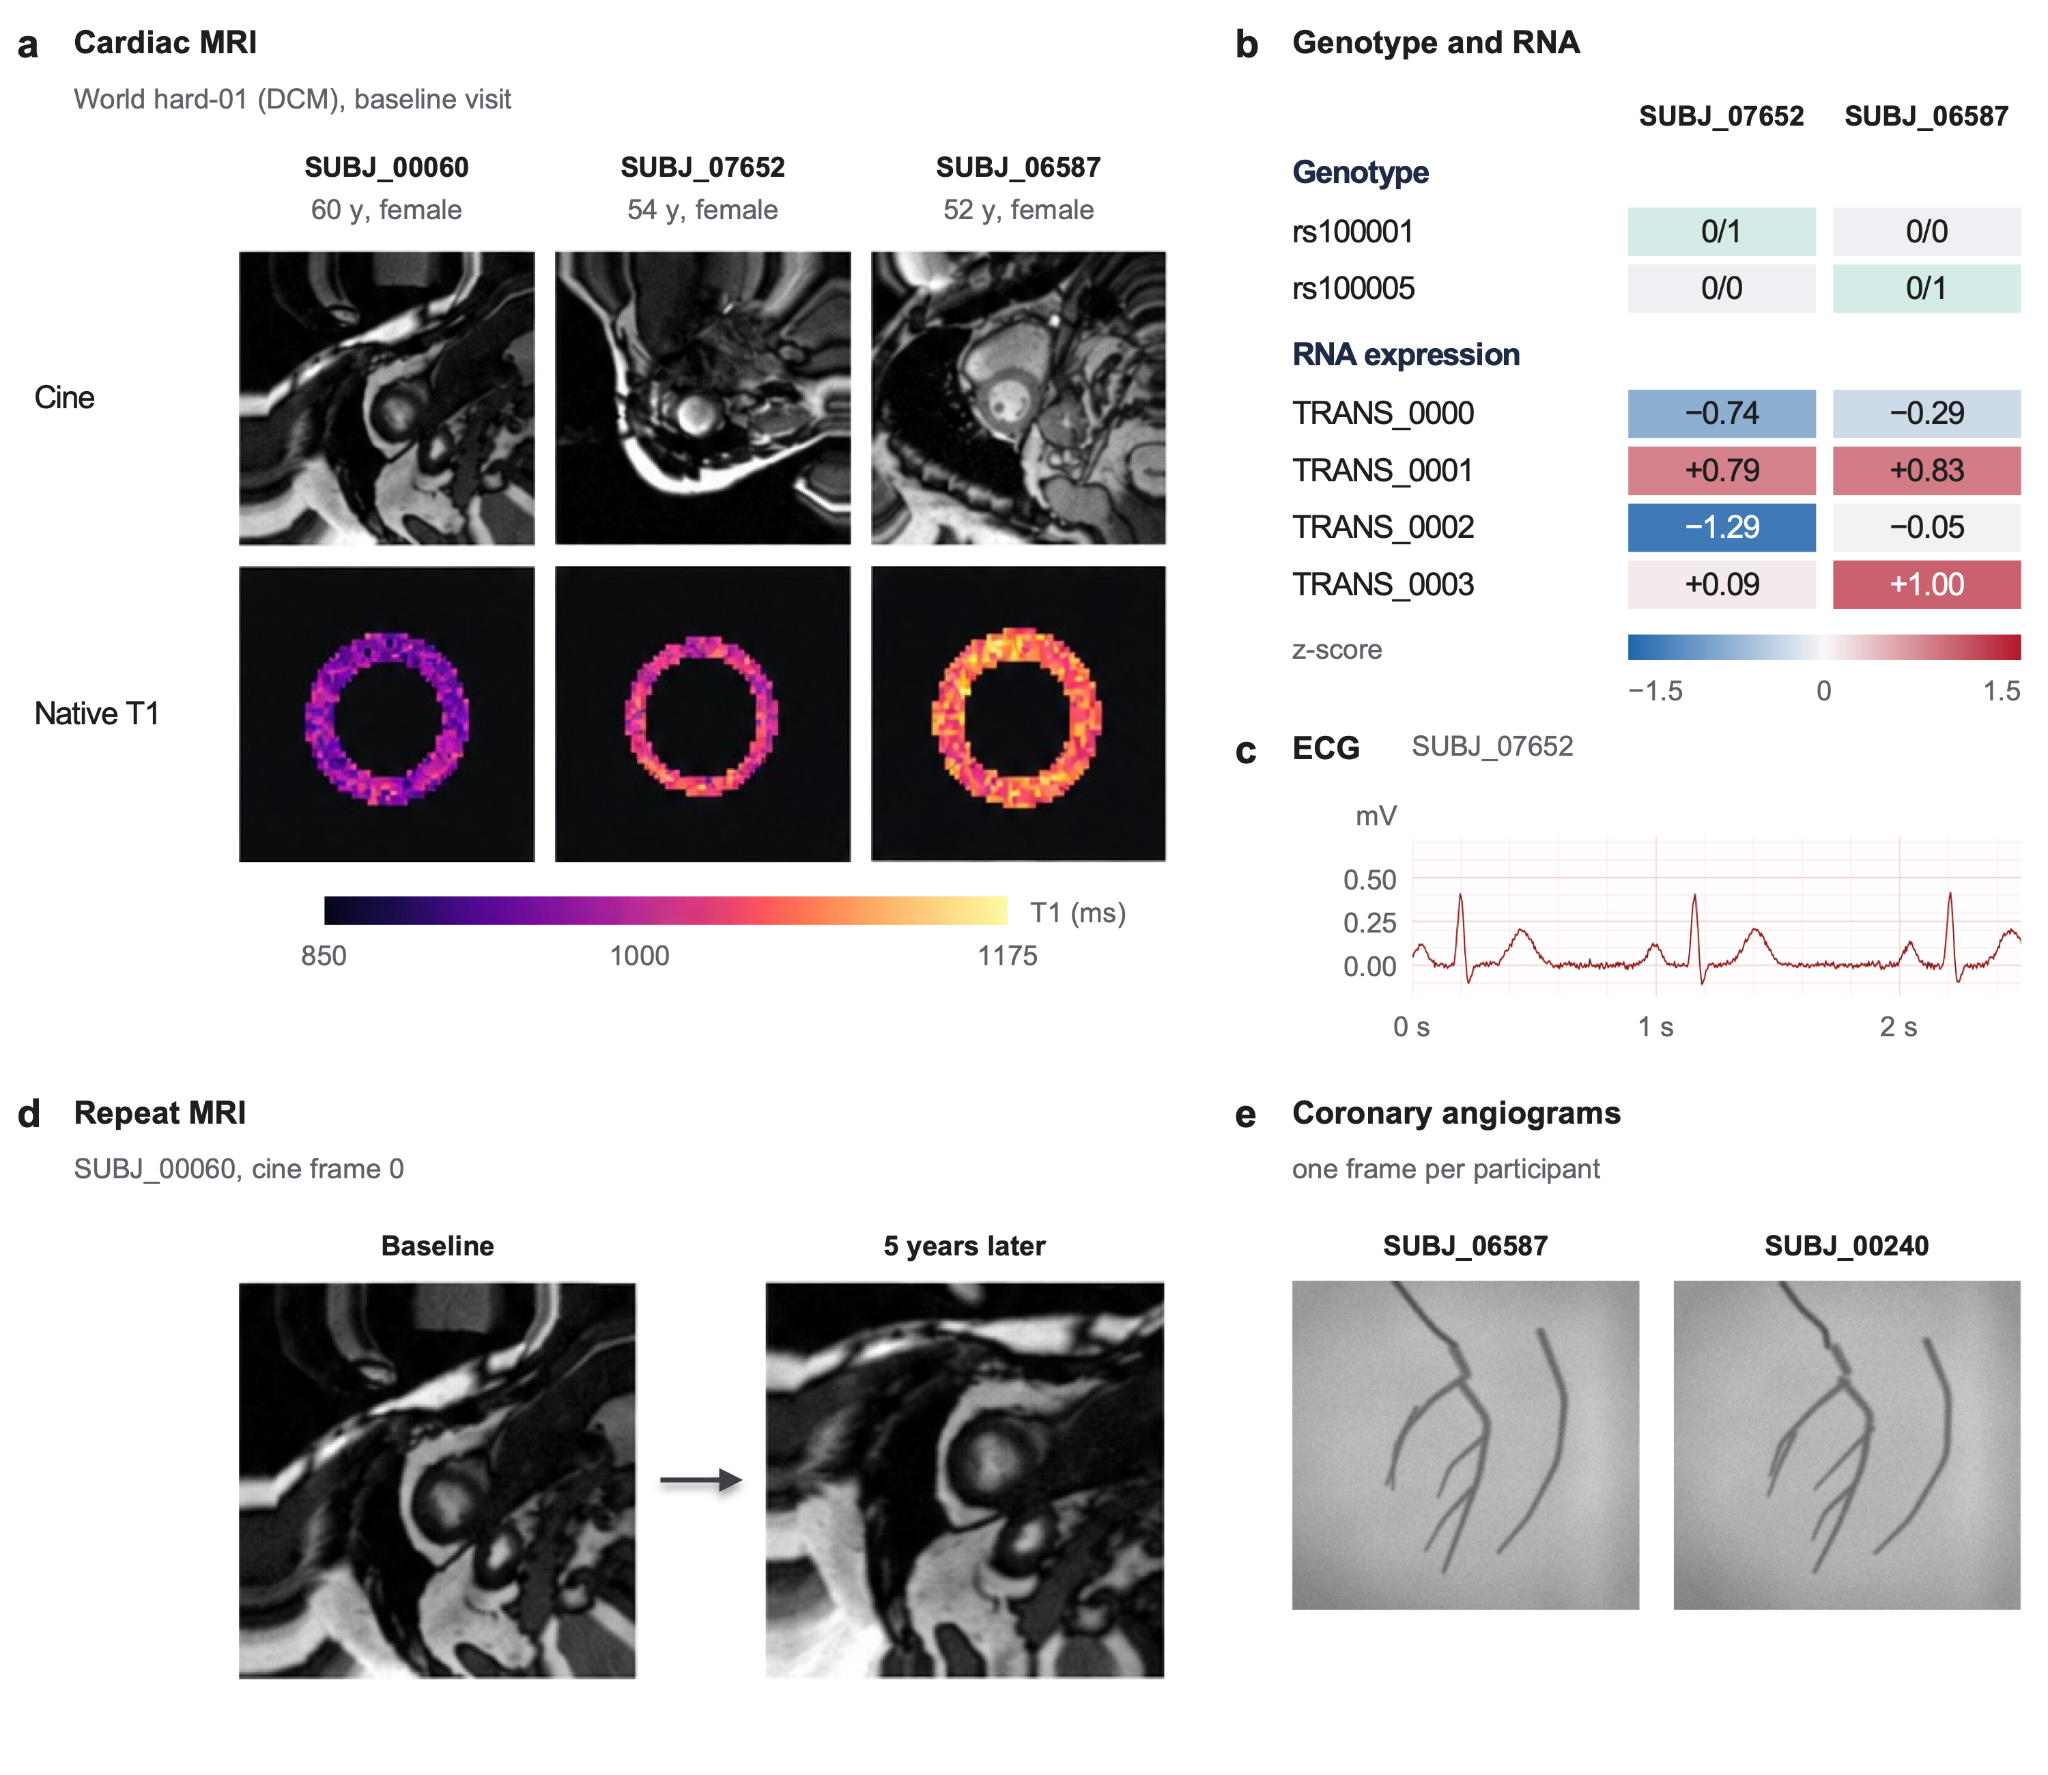
To address these gaps, we developed DrugTargetWorld, an environment that supplies this reward by procedurally generating population biobanks with known causal structure. Each simulated biobank, or world, comes from a hidden causal model and holds genotypes, circulating proteins, health records, and outcomes for 54,000 participants, with raw cardiac magnetic resonance imaging (MRI) for 10,800 of them (Figures 1a and 2). The model differs between worlds and specifies a cardiac disease archetype, zero to six causal driver proteins that alter latent disease severity, non-causal proteins that appear causal, and a harmful surrogate that improves imaging measures while shortening survival. The current evaluation focuses on cardiovascular disease archetypes as initial test cases; the same world-generation framework can be extended to other disease domains. Because latent severity is never observed, the agent must construct a disease phenotype as well as identify causal drivers and their intervention directions. Anonymous protein labels require it to derive every causal claim from the released data without drawing on published knowledge. Our primary aim was to determine how well current agents perform this work when they choose their own research strategy, including which of an unknown number of candidates to pursue and, given a budget, which virtual follow-up experiments to perform and how to use the returned results.
We evaluated nine agents in 540 episodes across 20 worlds and three experimental budgets. The leading agents, Opus 5 and GPT-5.6 Sol, built disease phenotypes from raw data and applied genetic instruments, yet no agent averaged more than 40 of 100 points. Their performance was limited mainly by the judgments that connect these analyses, namely how to measure the disease, which evidence separates a causal driver from a non-causal protein, and when a claim is sufficiently supported. Because new worlds can be generated as needed, DrugTargetWorld can also supply verifiable rewards for training agents across the entire workflow, and strategies learned in this way can then be tested in real cohorts.
2. Related work
Biobank-based drug target discovery . Population biobanks have enabled the analysis of genetic, imaging, and longitudinal data for drug target discovery. Proteogenomic studies have mapped genetic determinants of circulating proteins and connected these measurements to cardiovascular disease phenotypes (Lind et al., 2024; Reddy et al., 2025; Sun et al., 2023) . Building on these resources, instrumental-variable (IV) methods such as Mendelian randomization, along with colocalization and related genetic approaches, have been used to distinguish proteins associated with disease from those with stronger causal evidence (Henry et al., 2022; Rasooly et al., 2023, 2025) . More broadly, human genetic evidence has been associated with an increased probability of success during drug development, which has motivated its wider use for target prioritization (Duffy et al., 2024; King et al., 2019; Minikel et al., 2024; Nelson et al., 2015) . These studies establish a mature workflow for population-based drug target discovery. However, the analysis itself is still typically carried out by human investigators. In DrugTargetWorld, by contrast, this workflow becomes a sequential decision problem in which an agent must determine which analyses and experiments to perform under finite resources.
Computational phenotyping in population biobanks . Each of these analyses depends on how the disease phenotype is defined, and computational phenotyping is increasingly used to derive such phenotypes in population-scale biobanks. In the UK Biobank, automated processing and analysis of cardiac and brain imaging have enabled the derivation of quantitative phenotypes that would be impractical to obtain through manual measurement (Aung et al., 2022, 2023; Gomes et al., 2024; Smith et al., 2021) . Other studies have constructed phenotypes from imaging and longitudinal tabular data (An et al., 2023; Gong et al., 2021, 2023; L. Yang et al., 2023; Z. Yang et al., 2026) . These studies show that phenotype construction can change which biological associations are subsequently discovered. In DrugTargetWorld, phenotype construction is part of the task itself, because latent disease severity is never observed and the agent must derive its own participant-level disease phenotype from the released data.
Scientific agents and benchmarks . A separate line of work evaluates AI agents directly, and recent benchmarks such as ScienceAgentBench and DiscoveryBench have moved from evaluating static scientific knowledge toward testing whether agents can execute research workflows (Chen, 2025; Majumder et al., 2024) . BixBench evaluates agents on real bioinformatics analyses, while BixBench3 extends this work to full study workflows in which agents start from raw biological data and reproduce outputs from published studies (Koch, 2026; Mitchener et al., 2025) . In BixBench3, however, the research question and analysis methods are largely specified for the agent (Koch, 2026) . In GeneBench-Pro, agents receive a biological dataset and a target estimand for a defined question and must then choose the appropriate statistical analyses across several dependent steps (Li & Ho, 2026) . MRAgent automates Mendelian randomization analyses across existing genetic resources, thereby addressing one part of the broader drug target discovery process (Xu et al., 2025) . Evaluating the whole workflow matters particularly for drug target discovery, where experimental validation is costly in both money and time, and agents must therefore prioritize which candidates merit testing. In contrast to these benchmarks, DrugTargetWorld leaves the research strategy across the entire workflow to the agent, which must construct the disease phenotype, determine which analyses and experimental evidence to acquire, and integrate potentially conflicting evidence. The agent then nominates causal drivers and their intervention directions for scoring against the hidden ground truth.
Interactive environments and agent learning. A parallel line of literature evaluates agents through their interaction with an environment rather than against a fixed task. Procedural environments have been used to test whether agents can generalize to new settings (Cobbe et al., 2020) . ScienceWorld brings this idea to science by requiring agents to perform a sequence of actions and run experiments rather than answer static questions (Wang et al., 2022) . AgentGym and SWE-Gym extend this approach by using executable environments for both training and evaluation of agents (Pan et al., 2025; Xi et al., 2025) . Aviary applies this idea to scientific agents and shows that they can improve through training via repeated interactions with scientific environments (Narayanan et al., 2024) . ResidencyRL trains clinical agents with reinforcement learning through simulated multi-turn patient encounters (Liévin et al., 2026, doi:10.48550/arXiv.2608.07418). DrugTargetWorld applies this framework to population-scale drug target discovery. Each world is generated from a different hidden causal model, and the agent chooses which evidence to collect and which experiments to pursue.
Causal discovery benchmarks. Causal benchmarks likewise generate synthetic data from known causal systems, so that model conclusions can be compared with the ground truth. Earlier work focused on causal direction and graph recovery, as well as on questions about associations, interventions, and counterfactuals (Jin et al., 2023; Mooij et al., 2016; Zhou et al., 2024) . CausalDS generates structural causal models and tests whether agents can draw the correct causal conclusions about the resulting data (Leban & Sun, 2026) . CausalGame asks agents to design experiments in settings with hidden confounding, selection bias, and measurement error, and thereby tests their actions when causal evidence is misleading (Chen et al., 2026) . In CausaLab, agents intervene in a synthetic laboratory and are scored both on whether they solve a prediction task and on whether they recover the underlying causal mechanism (J. Yang et al., 2026) . DrugTargetWorld builds on these ideas but treats causal reasoning as one part of drug target discovery, in which the agent must also construct the disease phenotype and separate causal drivers from non-causal proteins among thousands of candidate proteins.
Table 1 | Comparison of DrugTargetWorld with scientific agent benchmarks, training environments, and causal discovery benchmarks. Representative benchmarks are compared across design dimensions relevant to end-to-end evaluation of scientific agents. The table characterizes task structure rather than benchmark difficulty.
| Benchmark | Task | Method choice | Sequential | Simulated | Ground truth | Biobank | Trainable |
|---|---|---|---|---|---|---|---|
| ScienceAgentBench | Scientific analysis | Defined | Limited | No | No | No | No |
| DiscoveryBench | Scientific discovery | Defined | Limited | Variable | Variable | No | No |
| BixBench | Bioinformatics | Defined | Yes | No | No | No | No |
| BixBench3 | Full study execution | Guided | Yes | No | No | No | No |
| GeneBench-Pro | Genetic analysis | Open analysis | Yes | Yes | Yes | No | No |
| Aviary | Scientific tasks | Task specific | Yes | Variable | Variable | No | Yes |
| ResidencyRL | Clinical care | Scenario defined | Yes | Yes | Scenario | No | Yes |
| Causal benchmarks | Causal discovery | Variable | Variable | Yes | Yes | No | Variable |
| DrugTargetWorld | Drug target discovery | Open strategy | Yes | Yes | Yes | Yes | Yes |
N otes. “Method choice” describes how much of the analysis the agent selects. “Defined” means that the task specifies the analysis, “Guided” means that the research question and high-level methods are given, and “Open strategy” means that the agent chooses the phenotype, hypotheses, analyses, experiments, and stopping point. “Sequential” denotes multiple dependent research decisions within a task, and “Limited” denotes one or a few analysis steps. “Simulated” denotes synthetic data generation. “Ground truth” denotes known data-generating and intervention effects, and “Scenario” means that each simulated case defines the correct outcome. “Biobank” denotes linked participant-level population data. “Trainable” denotes an environment that can supply a verifiable reward for training. “Variable” means that the entry depends on the task.
3. Methods
DrugTargetWorld generates simulated population biobanks, which we call worlds, from hidden causal models whose causal drivers, non-causal proteins, and planted biases are known. Agents receive only the released data. From these data, an agent must extract relevant measurements, construct a disease phenotype, identify causal drivers and their intervention directions, and decide which analyses or experiments to perform within its experimental budget. An episode is one evaluation of one agent in one world under one experimental budget condition. At the end of each episode, the agent's submission is scored against the hidden causal ground truth, which is possible only because each world is generated with a known answer.
3.1 World generation
Each world is generated from a structural causal model that specifies genetic variation, molecular measurements, latent disease severity, observed disease phenotypes, longitudinal outcomes, and responses to experimental intervention. A procedural seed determines the world-level parameters, including the causal drivers, their effect sizes, the disease archetype, and the planted biases. These parameters are sampled once and held fixed for every agent evaluated in that world, so that score differences between agents within a world reflect their analyses rather than differences in the data.
Participant covariates are drawn from population distributions, and genetic variants are generated with allele-frequency and linkage-disequilibrium structure. Molecular measurements are then generated from cis and trans genetic effects, shared latent biological factors, participant covariates, and assay noise. To keep these distributions plausible, the evaluated panel was calibrated to aggregate distributions reported in the Multi-Ethnic Study of Atherosclerosis (MESA), including published MESA cohort summaries and TOPMed-linked MESA data (Heckbert et al., 2006; Liu et al., 2013; Marques et al., 2022) . These sources informed demographic distributions, which participants received MRI, and the means, standard deviations, and selected correlations of cardiac MRI traits; TOPMed-linked MESA data additionally informed the allele-frequency and linkage-disequilibrium structure of the genetic variants and the protein missing-data rate. Only cohort-level summary statistics were used, and no MESA participant data were resampled into any world. The causal structure, molecular effects, and intervention effects were designed rather than estimated from MESA (Supplementary Methods S1.1). We first generate each molecular measurement as a combination of cis and trans genetic effects, shared latent biological factors, participant covariates, and assay noise. For participant i and molecular feature j:
𝑀𝑖𝑗= z[ αjGi,cis(j) + βjGi,trans(j) + FiTλj + ηjTCi + εij]
Transcript and protein levels are generated with the same structure, so they can share genetic and biological influences without a fixed transcript-to-protein causal relationship, and the agreement between them differs across worlds.
Disease is generated through a latent disease severity Li, which is never released to the agent. For participant i, Li is generated from a hidden set of causal molecular drivers 𝒟 :
z[ ∑j∈𝒟 wjPij + γTCi + δGi,direct + εi]
Here, Pij is the abundance of molecular driver j, Ci contains participant covariates, Gi,direct captures genetic effects on disease not mediated through the measured molecular drivers, and εi represents residual variation. The number and identity of causal drivers, their effect sizes, instrument strengths, and disease architecture vary across worlds, whereas every protein has a single cis instrument, so estimates cannot be compared across independent instruments. In the evaluated panel, one null world contained no causal driver, and each of the other 19 contained between two and six (Supplementary Table S3).
Latent disease severity is then expressed through multiple observable phenotypes, whose pattern depends on the disease archetype. The evaluated panel contained six worlds each of the dilated cardiomyopathy (DCM), hypertrophic cardiomyopathy (HCM), and heart failure with preserved ejection fraction (HFpEF) archetypes, and two of the ischemic archetype:
𝑧(𝑌𝑖𝑘) = αa,kLi + βkTCi + δkPi,T8 + εik
where Yik is an observed phenotype k and α denotes the disease archetype. The archetype-specific coefficient αa,k allows the same latent disease severity to produce different patterns across medical imaging, physiologic signals, clinical measurements, electronic health record (EHR) diagnoses, longitudinal visits, and survival outcomes. The final term represents the harmful surrogate (bias T8, described below), a protein that improves imaging phenotypes without being a causal driver, and one such protein was planted in each of the 20 evaluated worlds.
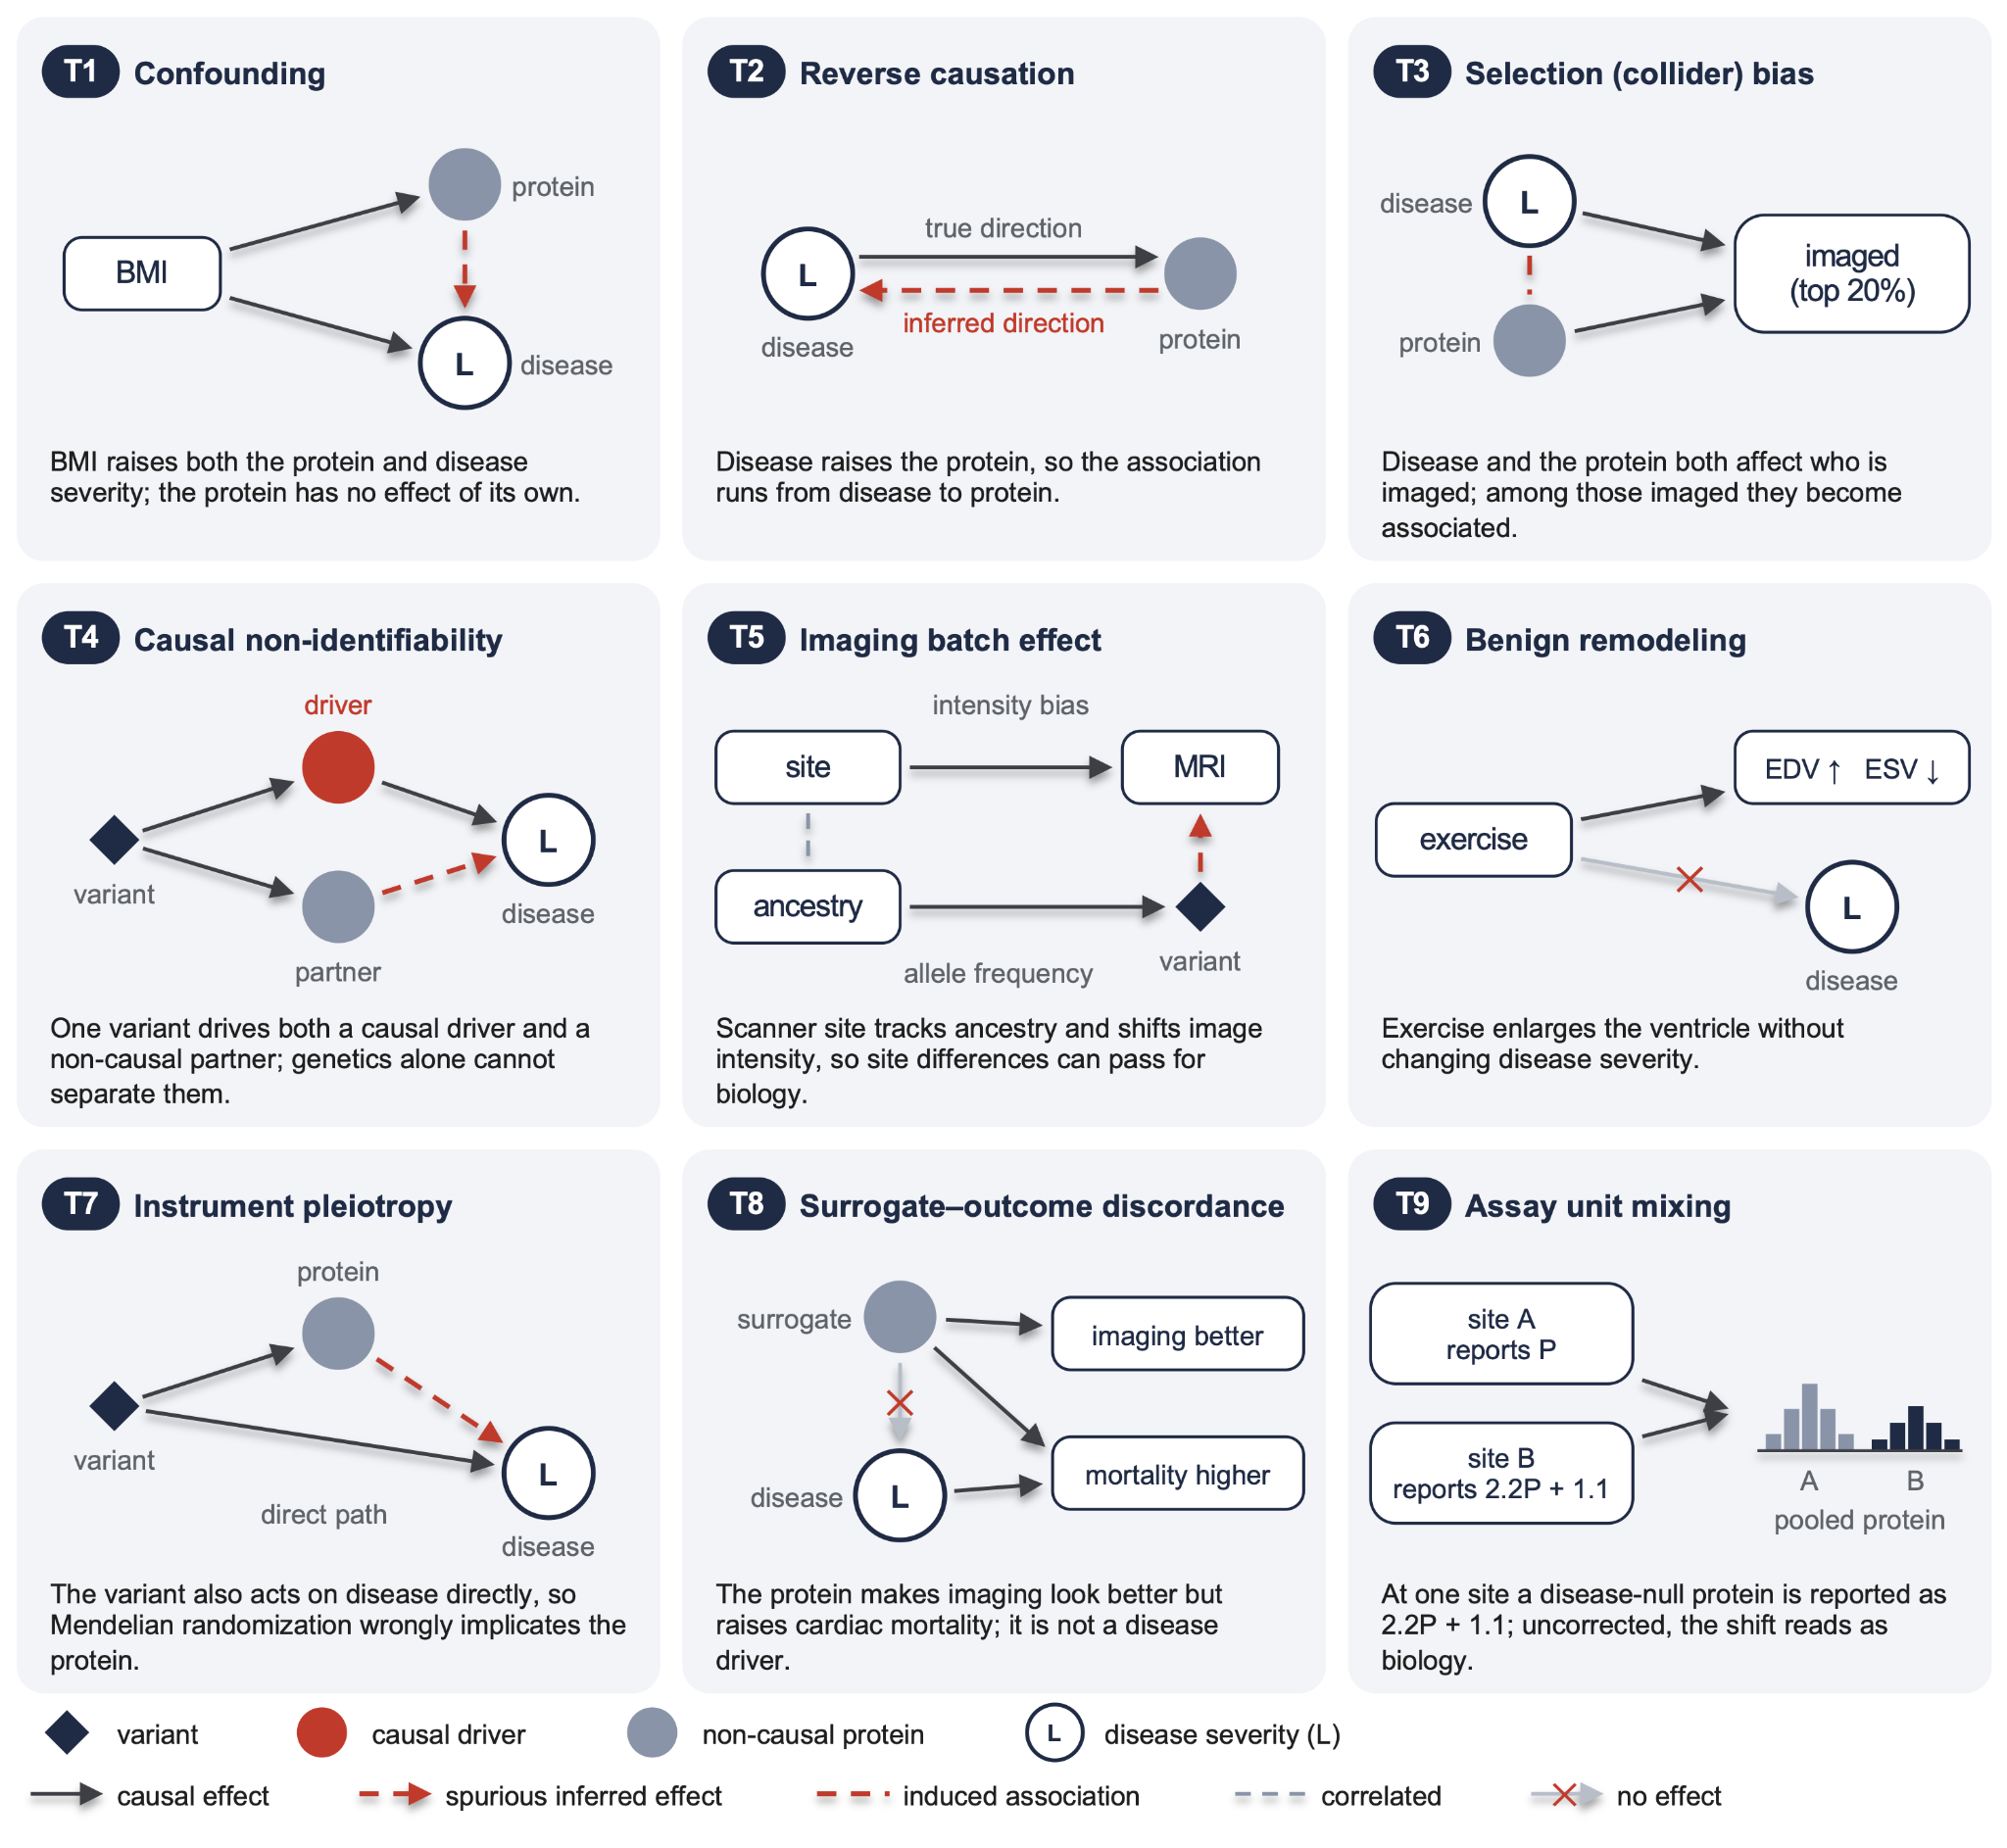
Beyond this core model, the generator can plant nine predefined biases, labeled T1 to T9 (Figure 3), which represent recognized ways in which observational biobank evidence can mislead, including the confounding, reverse causation, selection bias, pleiotropy, and measurement artifacts noted in the Introduction. These are confounding (T1), reverse causation (T2), selection bias (T3), causal non-identifiability (T4), imaging batch effects (T5), benign physiologic remodeling (T6), instrument pleiotropy (T7), surrogate–outcome discordance (T8), and assay unit mixing (T9). T4 and T6 are not biases in the strict statistical sense, but they also make observational evidence misleading. Each bias alters the causal or measurement process rather than adding random noise, so the proteins it affects can appear scientifically plausible. In the evaluated panel, T5, T6, and T8 were present in all 20 worlds, T1 in 18, T2 in 14, T3 in 12, T7 in 8, T4 in 6, and T9 in 5. In addition, 15 worlds contained a delayed-effect driver, a causal driver whose effect is expressed mainly over five years of follow-up and which is paired with a non-causal partner that tracks the later disease. T4 and the delayed-effect design both create a pair of proteins that observational data cannot separate, which we call an ambiguous pair. T4 creates a shared-instrument pair and the delayed-effect design a delayed-effect pair, and the causal-confidence score evaluates these ambiguous pairs (Section 3.5). The implementation of each bias is detailed in Supplementary Methods S1.4.
3.2 Synthetic biobank
For each world, the causal model generates a participant-level biobank (Figure 2) that links genetic, proteomic, transcriptomic, and metabolomic data with raw cardiac MRI, electrocardiogram (ECG) features, coronary computed tomography (CT) features, EHR diagnoses and medications, mortality, and major adverse cardiovascular events (MACE). Each evaluated world contains 54,000 participants, 2,941 proteins, and 8,192 genetic variants, with cardiac MRI for 10,800 participants (20%). These dimensions are benchmark design choices inspired by the scale of UK Biobank rather than estimates from its data (Supplementary Methods S1.1). As in MESA, the imaged participants are not a random sample, because imaging participation depends on age, body mass index, ancestry group, and study site, and in the 12 worlds carrying T3 also on latent disease severity and a selected protein. A random 20% of participants attended a second visit about five years later, at which covariates and proteomics were measured again, with repeat MRI for those who had been imaged. A per-protein targetability table is also released, describing each protein's subcellular localization, binding pocket, paralog redundancy, genetic constraint, and tissue specificity, but it does not contribute to the score. Every protein and transcript carries an anonymized identifier with no mapping to a real gene, so an agent cannot draw on published knowledge about any protein and must reach its conclusions from the released data alone.
Neither latent disease severity nor any imaging-derived measurement is released. Phenotype construction, the choice and combination of released measurements into a participant-level disease phenotype, is therefore part of the drug target discovery task. An agent may build its phenotype from any released data, but an agent that uses cardiac MRI must first extract quantitative features from the raw cine and native T1-mapping images. These images are rendered on anatomical templates from the public ACDC cardiac MRI dataset (Bernard et al., 2018, doi:10.1109/TMI.2018.2837502) and deformed to each participant's simulated morphology. The data also contain missing modalities, measurement noise, genetic instruments of varying strength, and variable agreement between transcript and protein levels, imperfections that agents would also encounter in a real biobank.
3.3 Agent environment and harness
Within each episode, the agent works in a computational sandbox that contains the released biobank files and a writable working directory. It analyzes the data by writing Python programs that the harness executes, so that every analysis is recorded as an explicit computation.
The harness is the software interface between the agent and the world. We used a deliberately minimal harness so that differences in score reflect the agents' own research strategies rather than scaffolding that differs between systems. It supplies the task instructions, the two purchasable virtual experiments, the output of each program executed within the current episode, and the required submission format (Supplementary Methods S3.1). The instructions state that a small number of proteins causally drive cardiac disease and name the five sources of bias by which other proteins can appear associated, namely confounding, reverse causation, selection into the imaged subcohort, pleiotropy, and measurement artifact, but they do not identify any protein. Apart from a helper function for reading genotypes, the harness provides no analysis tools or analysis plan, and it gives no feedback on scientific correctness.
The released data are formatted to resemble a population biobank. Proteomics, transcriptomics, metabolomics, diagnoses, medications, and other structured measurements are provided as tabular files, with covariates documented in a data dictionary. Genotypes are provided in variant call format (VCF), and each imaged participant has one file containing cine images and native T1 maps. The data are linked by participant identifiers, and the agent must join them itself. Proteins, transcripts, and metabolites are identified only by anonymous labels (for example, PROT_0412), so published knowledge about named molecules cannot point an agent to a causal driver.
Each episode allows at most 30 turns, and each turn may contain one Python program. This limit was raised from an initial 15 turns after pilot episodes showed that the shorter limit, rather than the agents' own strategies, determined when most episodes ended. After each turn, the harness returns the program's output or error, the contents of the working directory, and the remaining experimental budget and turns. Files persist across turns. An episode ends when the agent writes a parseable submission or reaches the turn limit, and whatever submission and phenotype files are present at that point are scored (Supplementary Methods S2.4). Because the instructions invited agents to revise a provisional submission, this rule could end an episode earlier than an agent intended. The complete interaction history and executed code are recorded (Supplementary Methods S3.2), and Figure 1d,e follows one such episode from the agent's turn-by-turn activity to the scoring of its claims.
3.4 Action space and experiments
Laboratory experiments are expensive, so a useful agent must judge when an experiment is worth its cost. We therefore evaluated each agent under three experimental budget conditions. The observational-only condition ($0) allows no experiments, the limited condition ($450,000) pays for one knockdown or three cell perturbations, and the expanded condition ($2 million) pays for up to five knockdowns. These amounts are intended as an ordinal scale of experimental access rather than as estimates of real experimental costs. The limited budget thus forces a choice between one knockdown and three cell perturbations, whereas the expanded budget allows several candidates to be tested by knockdown. The observational-only condition measures what an agent can conclude from the biobank alone. Both types of experiment are described below.
In all three conditions, analyses of the released biobank are free and unrestricted, so an agent can apply any statistical method that it can implement in Python.
Agents with an experimental budget could purchase two types of simulated intervention, each applicable to any protein. A cell perturbation cost $150,000 and measured the effect at the first visit, whereas an in vivo knockdown cost $400,000 and measured the effect over five years of simulated follow-up (Supplementary Methods S1.5). Because the cheaper experiment cannot detect a delayed effect, choosing between the two is part of the task. For either experiment, perturbing protein j returned the change in four outcomes relative to the unperturbed state:
Δj = (Δ cavityr, Δ wallt, Δ EF, Δ surv5y)
where each Δ is the mean outcome under perturbation minus the mean outcome without perturbation. Cell perturbation was based on a smaller virtual experiment and included measurement noise, whereas knockdown used a larger virtual experiment and returned the longer-term intervention effect without additional measurement noise.
An agent's work can therefore be viewed as a sequence of decisions, each chosen from the evidence gathered so far and the budget that remains, a formulation that also defines the policy that training in this environment would optimize:
at ∼ π(a | st, Bt)
where st represents the evidence accumulated by turn t, Bt is the remaining experimental budget, and at is the next analysis or experiment selected by the agent. Experimental actions update the remaining budget according to
Bt+1 = Bt − c(at)
with c(at) = 0 for analyses of released biobank data.
At the end of each episode, the agent submits its claims. It nominates candidate causal drivers, each with an intervention direction (inhibit, activate, or unknown) and an outcome-alignment label. The label predicts whether a treatment that improves the disease phenotype through that protein would also improve survival (aligned), worsen survival (misaligned), or have an uncertain effect (unknown). The agent also lists rejected proteins, each with the source of bias that makes it appear causal, and records abstentions that name small sets of proteins that it cannot distinguish. Finally, it submits a participant-level disease phenotype, and Section 3.5 describes how each element of the submission is scored.
3.5 Scoring
Each part of the final submission is scored against the hidden ground truth. More than half of the 100 points reward finding the causal drivers with confidence matched to the evidence, through target identification (30 points) and causal confidence (25 points). The remaining points reward the intervention direction for each driver (20 points), bias identification (15 points), and phenotype construction (10 points). Safety adds no points, but advancing the harmful surrogate as beneficial incurs a 30-point penalty, equal to the full weight of target identification. These components correspond to the judgments that the task requires. Phenotype construction scores how well the agent measures the disease, target identification and bias identification score whether it separates causal drivers from non-causal proteins, causal confidence scores whether its claims are as strong as its evidence allows, and intervention direction scores the actionable conclusion for each driver. The final score is the sum of the five component scores and the safety penalty, bounded between 0 and 100:
Stotal = clip(Starget + Sconfidence + Smechanism + Sdirection + Sphenotype + Psafety, 0, 100),
where Smechanism denotes the bias-identification score. Each component is defined below. Sensitivity of the model ranking to removing phenotype credit is reported in Supplementary Methods S2.6.
Target identification (30 points) rewards finding the causal drivers without nominating proteins that are not drivers.
Starget = 30 × Recall × Precision.
Recall is the fraction of causal drivers that the agent nominated, and precision is the fraction of its nominations that are causal drivers. Because the two are multiplied, nominating many proteins to raise recall lowers precision, and full credit requires the exact set of drivers. Planted non-causal proteins and the harmful surrogate count as false positives.
Causal confidence (25 points) measures whether the agent's causal claims match the strength of its evidence. It is informative mainly in the 17 worlds that contain at least one ambiguous pair created by T4 or by the delayed-effect design, in which observational data cannot distinguish the causal member from its partner. In the two non-null worlds without such a pair, the score is a rescaling of target identification:
Sconfidence = 25 × Starget / 30.
In worlds containing K planted ambiguous target pairs,
Sconfidence = (1/K) × Σk=1K ck,
where ck is the credit for ambiguity k. A pair receives 25 points when the agent correctly identifies the causal protein and has experimentally tested that same protein. Recognizing that the pair cannot yet be resolved receives partial credit of up to 17.5 points, whereas an unsupported causal choice receives no credit. This ordering credits an explicit statement of unresolved ambiguity above an unsupported causal choice, because observational data alone cannot support a choice between the members of such a pair.
Full credit for a pair therefore requires an experiment on the protein that the agent names as causal. In the observational-only condition, the maximum credit per pair is consequently 17.5 points. Bias identification (15 points) measures whether the agent rejects the planted non-causal proteins, which only appear causal, and names the source of bias that produced each one:
Smechanism = 15 × Recallrejection × Precisionrejection.
A rejection counts as correct only when it names a planted non-causal protein together with its source of bias, chosen from confounding, reverse causation, selection bias, pleiotropy, and measurement artifact. Scored non-causal proteins are those planted by T1, T2, T3, T7, and T9, whereas the harmful surrogate is handled by the safety penalty. As in target identification, recall and precision are multiplied, so rejecting many proteins indiscriminately earns little credit.
Intervention direction (20 points) measures whether the agent correctly predicts whether a drug should inhibit or activate each causal driver. The score is averaged over all causal drivers in the world, excluding the causal member of an ambiguous pair on which the agent abstained. For each causal driver,
dj = 1 correct direction 0.5 explicitly unknown 0 incorrect or missing
The direction score is then
Sdirection = 20 × mean(dj).
A correct direction receives full credit, and an incorrect direction or a driver that was not nominated receives none. An explicit unknown receives half credit, and a nominated driver with no valid direction is treated as unknown. Half credit equals the expected value of guessing, so declaring uncertainty is neither rewarded nor penalized relative to a guess.
Phenotype construction (10 points) measures how closely the agent's submitted participant-level phenotype tracks latent disease severity. Let |r| denote the absolute correlation between the submitted phenotype and latent disease severity. With b the correlation achieved in that world by the environment's own MRI-derived baseline phenotype (Supplementary Table S3 and Supplementary Methods S2.5), Sphenotype = 10 × clip((|r| − b)/(0.85 − b), 0, 1); in a world without a valid recorded baseline,
Sphenotype = 10 × min(|r|/0.85, 1).
This fallback was never used, because a baseline was recorded for all 20 evaluated worlds. The baseline phenotype is computed by the environment from the released cine and native T1-mapping images, and agents cannot access it or its value. Across worlds, b ranged from 0.40 to 0.76, and the score rises linearly from zero at b to full credit at a fixed ceiling correlation of 0.85. Because every released measurement carries noise, no phenotype can correlate perfectly with latent disease severity, so full credit is given below a correlation of 1, and the best phenotypes in this evaluation approached the 0.85 ceiling (Supplementary Table S7B). An agent that merely reproduces a standard imaging summary therefore gains no benefit. Correlations are computed on a sealed random sample of 20% of all 54,000 participants, drawn without regard to imaging, using the participants in that sample for whom the submitted phenotype has a value. A phenotype derived only from cardiac MRI is therefore scored on the imaged members of the sample, between 2,059 and 2,278 participants depending on the world, and the baseline phenotype is scored in the same way. Finally, the score penalizes the most consequential error: recommending a target whose benefit for the disease phenotype would come at the cost of survival. The harmful surrogate planted in every world improves imaging phenotypes but increases cardiac mortality and is not a causal driver. If the agent nominates the harmful surrogate and labels it aligned, predicting that treatment through it would also improve survival, 30 points are subtracted. Labeling it misaligned or unknown avoids the penalty, but the nomination still counts as a false positive in target identification:
Psafety = −30 harmful surrogate claimed as outcome-aligned
0 otherwise.
Special handling of null worlds, ambiguity abstentions, claim limits, and malformed outputs is described in Supplementary Methods S2.1–S2.4.
3.6 Evaluation
We evaluated nine language models as agents across 20 worlds and three experimental budget conditions, with one episode per model, world, and budget. The panel of 20 worlds was designed to cover all four disease archetypes and to include every bias in several worlds, while keeping the evaluation of nine agents under three experimental budgets tractable. This design yielded 540 episodes, 60 per model and 180 per budget condition, of which 360 could purchase experiments. The models were Opus 5, GPT-5.6 Sol, Sonnet 5, Haiku 4.5, GPT-OSS-20B, Qwen3-Coder-30B-A3B, GLM-4-32B, Qwen3-8B, and Devstral Small. Serving details are listed in Supplementary Table S1 and inference settings in Supplementary Methods S3.2. The open-weight models were chosen to be small enough to run on our local compute infrastructure while remaining capable enough to be candidates for future training on DrugTargetWorld. All models used the same harness, instructions, and sandbox.
The primary outcome was the total score. Secondary outcomes were the individual component scores, target precision and recall, experimental spending, model inference cost (Figure 4d), and completion of major research steps.
To characterize research workflows and failure modes, we also analyzed the complete recorded trajectories. A static audit of the executed code identified which data each program read and which calculations it performed, and it counted an analysis only when the calculation was executed, not when a library was imported or a method was named. In this exploratory analysis, the executed operations were grouped into six analysis families, each identified by a code signature, namely correlation or regression, covariate-adjusted regression, genotype-based computation, Mendelian randomization or instrumental-variable calculations, cross-molecular analysis, and repeat-visit or survival analysis. Separate indicators recorded phenotype creation, experiment purchases, nominations, submission, and references to returned experimental results. These measures describe what the agents computed and which data they accessed, not whether an analysis was statistically valid or correctly interpreted.
Statistical analysis. The world was the unit of analysis (n = 20), because a model's three budget episodes within a world share the same causal structure. For pairwise model comparisons, scores were first averaged across the three budgets within each world and model, and paired differences were then calculated across worlds. We report mean paired differences, 95% t-based confidence intervals (CIs), and exploratory two-sided paired t-tests, with exact sign tests and Wilcoxon signed-rank tests as sensitivity analyses. P values for these comparisons are not adjusted for multiplicity. Budget contrasts were likewise paired by world.
The trajectory analyses were exploratory. We compared the frequencies of the six analysis families between Opus 5 and GPT-5.6 Sol using paired world averages, 20,000 world-bootstrap resamples, and exact sign-flip tests with Holm correction. Each analysis family was then related separately to exact target recall and to the fraction of incorrect nominations, adjusting for model, budget, and world. Uncertainty was estimated with the CR2/Satterthwaite method, clustered over the 19 non-null worlds, and Holm correction was applied across these 12 exploratory tests (six analysis families and two outcomes). Incorrect-nomination fractions exclude episodes with no nominations. The pooled association between the number of core workflow milestones reached and score was summarized with Spearman's rank correlation and is descriptive. Finally, because there was one replicate per model, world, and budget, reported standard deviations describe variation across worlds and budgets rather than run-to-run stochastic variability.
4. Results
4.1 Leading agents recovered many causal drivers but remained unreliable across the full workflow
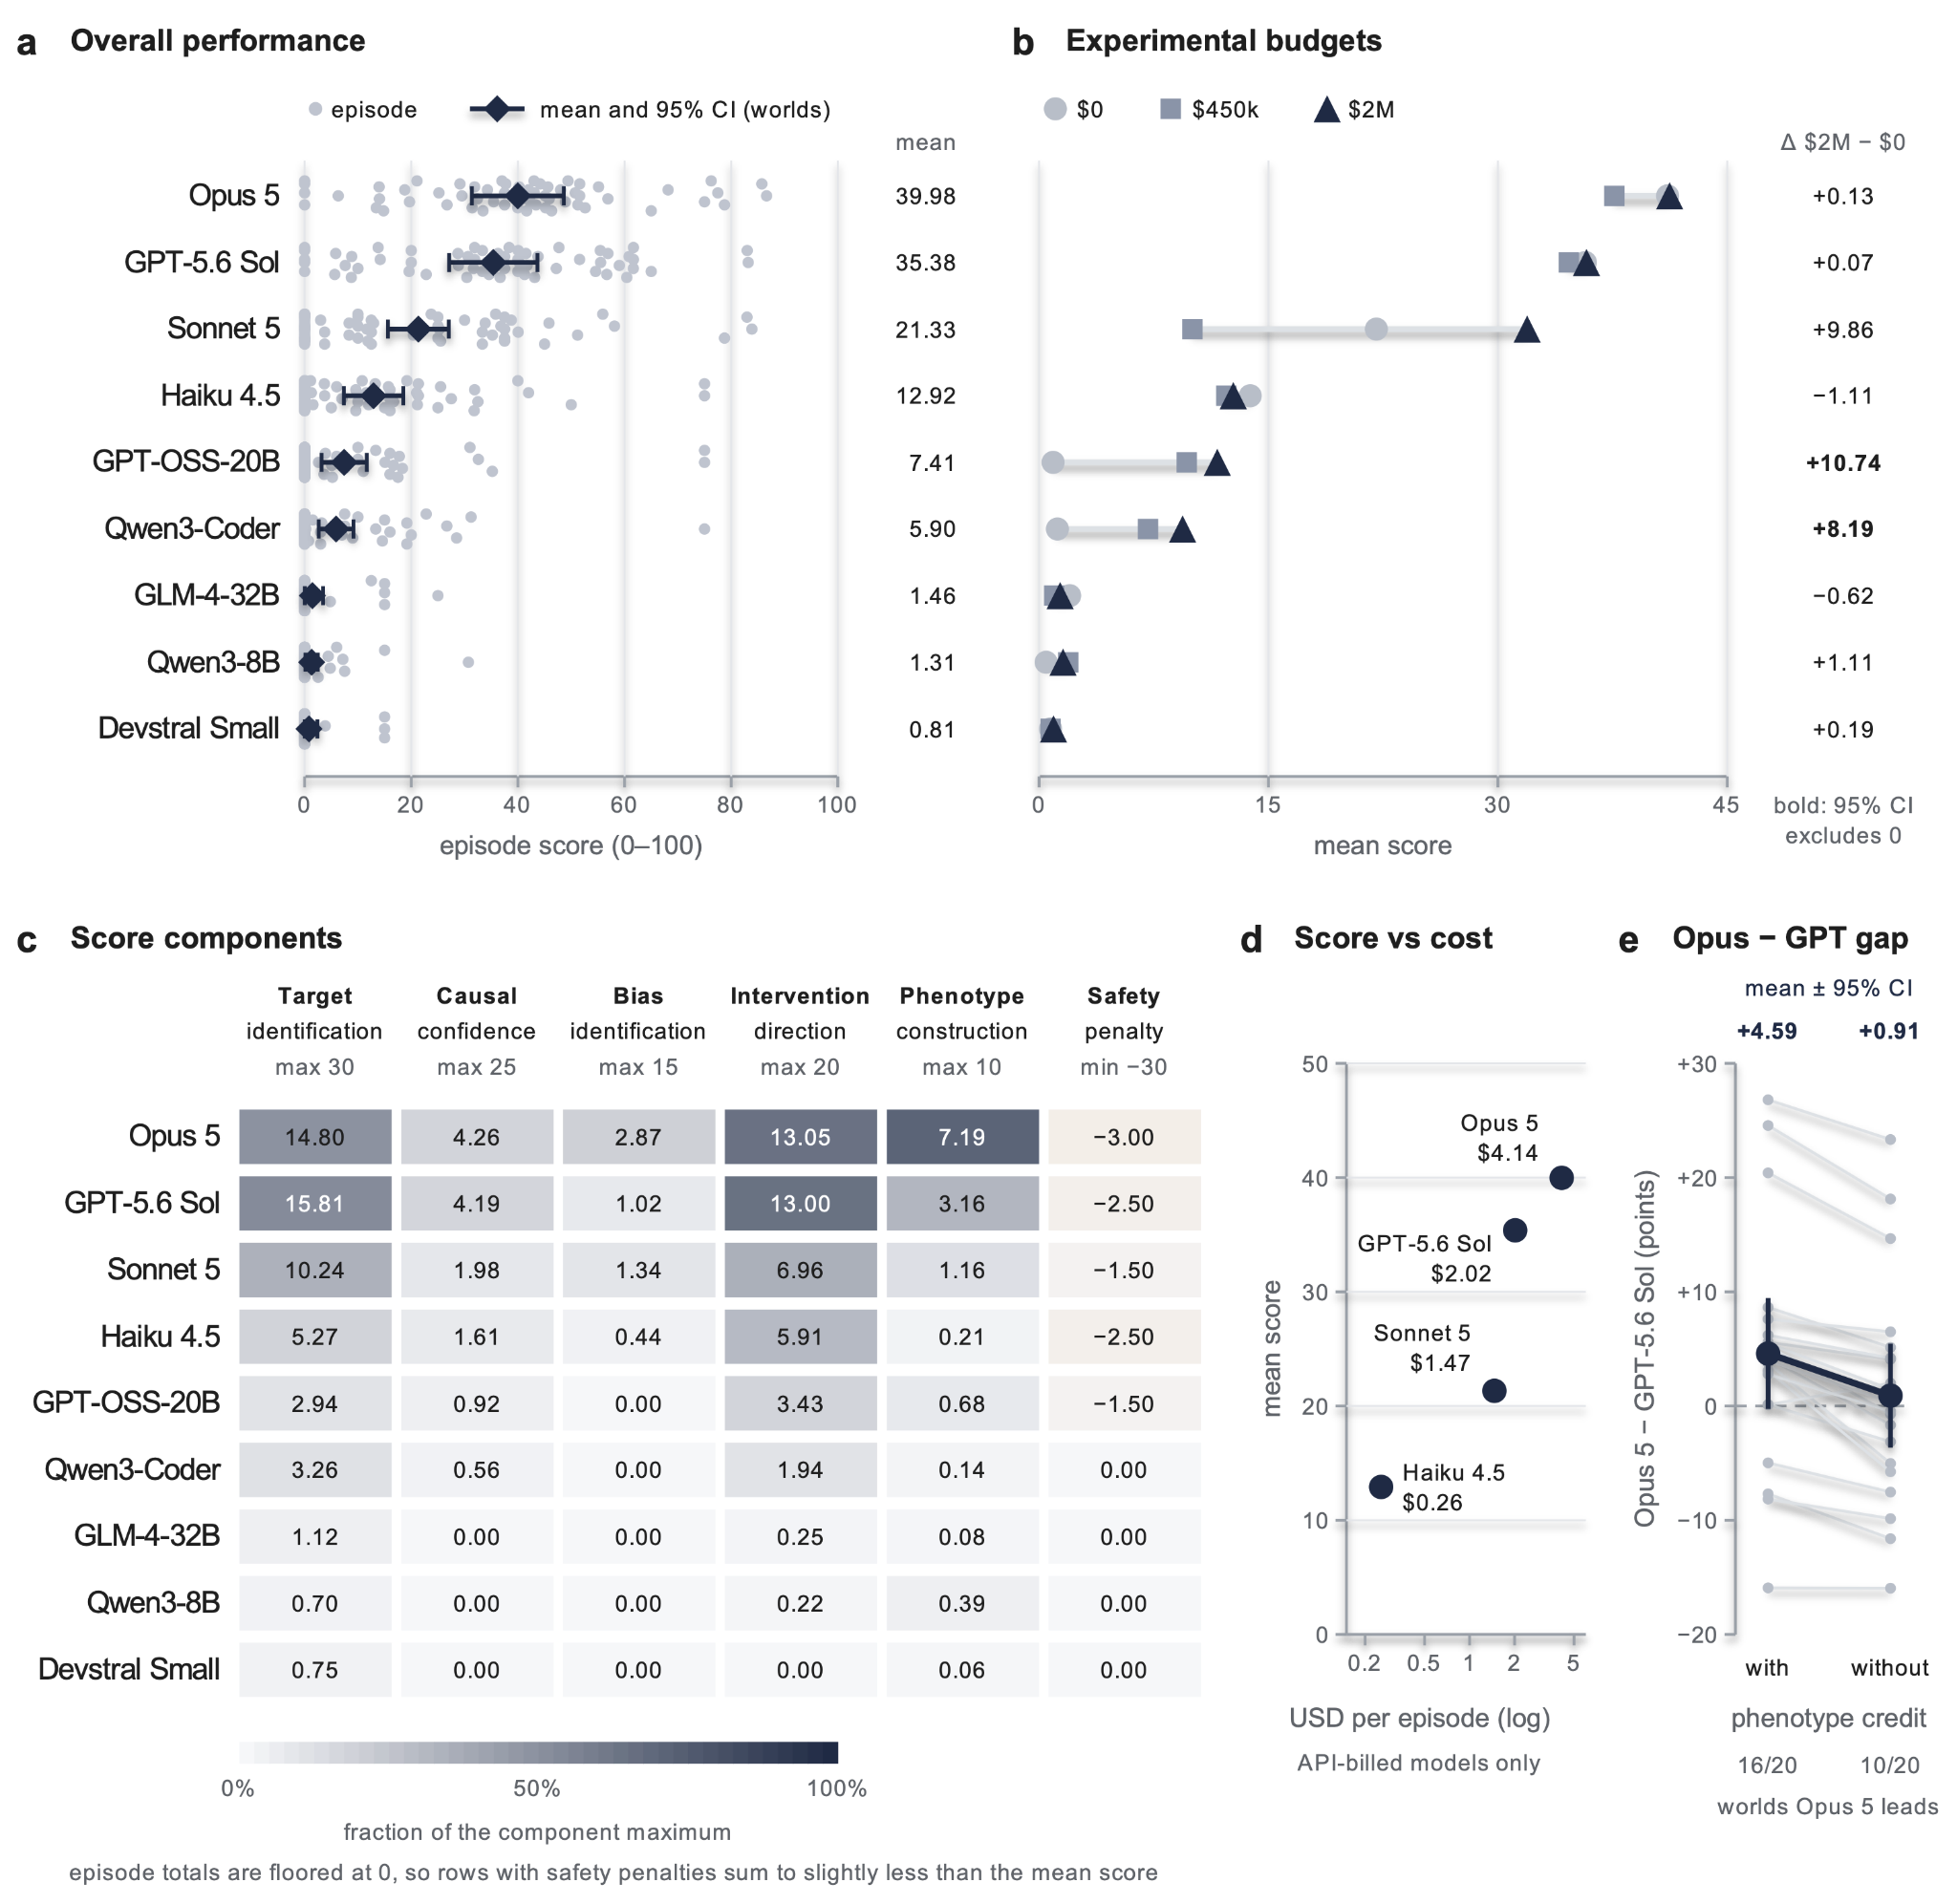
Opus 5 and GPT-5.6 Sol recovered similar fractions of causal drivers (target recall 0.64 for both) but achieved mean overall scores of only 39.98 and 35.38 of 100, reflecting failures elsewhere in the workflow.
Agents entered each simulated biobank without a prescribed analysis pipeline and had to develop their own strategy for identifying drug targets. Across all 540 episodes, the mean total score was 14.1 of 100, and fewer than half of the episodes (258, 47.8%) scored above 0. Sonnet 5 and Haiku 4.5 followed the two leading agents with means of 21.33 and 12.92, whereas the five open-weight models had mean scores of 0.81 to 7.41, each with a median of 0 (Figure 4a, Supplementary Table S4, and Supplementary Note S3).
For reference outside the model evaluation, two human-guided episodes, in which an investigator directed a language model, scored 37.5 and 81.67 and are included in the supplement as exploratory references. They were designed as qualitative workflow references rather than as a matched human baseline, and only the 37.5-point episode followed the standard evaluation protocol (Supplementary Notes S1 and S2).
Performance at the top of the range was confined to a few episodes. Six of the 540 model episodes (1.1%) scored above 80, five in heldout-hfpef-02 and one in heldout-hcm-01, and all six nominated exactly the two planted causal drivers with no false positives. Both worlds contain a T4 pair, in which a causal driver and a non-causal partner share a genetic instrument. The full 25 causal-confidence points therefore require a purchased experiment on the causal member, and none of the six episodes was observational. All six episodes also fell in the cells excluded from the sensitivity analysis for the follow-up MRI data-generation error described among the limitations, although excluding the affected reads did not change the order of the leading agents (Supplementary Table S11D).
Scores also varied with world design and were highest in the worlds with two causal drivers. They averaged 23.4 in the four two-driver worlds, compared with 11.2–12.2 in worlds with three to six causal drivers and 10.3 in the eight worlds designed to be difficult (Supplementary Note S3).
After averaging the three budgets within each world, Opus 5 exceeded GPT-5.6 Sol by a paired mean of 4.6 points across the 20 worlds (95% CI −0.26 to 9.45) and scored higher in 16 of them (Figure 4e). The paired t-test gave P = 0.062 and the exact sign test P = 0.012, so the difference is suggestive but not statistically conclusive. By contrast, every other pair among the four models differed when assessed through an application programming interface (API), with 95% CIs excluding zero (Supplementary Table S5). Because each model was run once per world and budget, these comparisons do not account for run-to-run variation.
The difference between the two leading agents lay mainly in phenotype construction, where Opus 5 averaged 7.2 of 10 points and GPT-5.6 Sol 3.2. It lay to a lesser extent in bias identification and was partly offset by a higher target-identification score for GPT-5.6 Sol (Figure 4c, Supplementary Table S4B). Without phenotype credit, the difference fell to 0.9 points (95% CI −3.64 to 5.46), and the ranking of all nine agents was unchanged (Supplementary Methods S2.6).
4.2 Phenotype construction separated the two leading agents
Opus 5 earned positive phenotype credit in 56 of 60 episodes, and GPT-5.6 Sol in 34 of 60. The phenotypes that correlated most strongly with latent disease severity were more often those that combined several imaging features and were checked against clinical endpoints before submission.
The first judgment the task required was how to measure the disease from the released data. Cardiac MRI was released only as raw images, without derived volumes, ejection fraction, or mass, so agents had to extract imaging features, assess their relevance, and combine them into a participant-level measure of disease before prioritizing targets. They could also draw on ECG, coronary CT, and outcome data (Supplementary Methods S3.1).
Performance on this step varied substantially across agents. Beyond the two leading agents, Sonnet 5 earned positive phenotype credit in 12 of 60 episodes and every other model in seven or fewer (Supplementary Note S3). Among the 349 phenotypes scored against latent disease severity, the mean correlations were 0.785 for Opus 5, 0.637 for GPT-5.6 Sol, and 0.502 for Sonnet 5 (Supplementary Table S7A). For comparison, the environment's MRI-derived baseline phenotype reached correlations of 0.40 to 0.76 across worlds, and full credit required 0.85 (Section 3.5).
These differences were associated with how agents constructed and validated their phenotypes. Phenotypes whose weights for several imaging features were learned from clinical outcomes and other observed disease signals correlated more strongly with latent disease severity than composites whose weights the agent chose by hand, and more strongly than single imaging measures (Supplementary Table S7B). The leading agents also checked the phenotype against other signs of disease already present in the dataset before submitting it. Among episodes with a scorable phenotype, those that performed this validation reached a mean correlation of 0.663, compared with 0.402 among those that did not (Supplementary Table S7C). Because these comparisons pool episodes across models, they are confounded with model identity.
The validation checks drew on mortality, coronary CT calcium or stenosis, MACE, ECG features, and EHR diagnoses, and in the source-linked traces they were used to choose among candidate phenotypes, not only to confirm the final one (Supplementary Table S7D). Because these endpoints are clinical or imaging measures rather than protein measurements, they keep the phenotype largely independent of the candidate proteins later tested against it. However, the T8 harmful surrogate affects cardiac mortality and MACE directly, so a phenotype fitted to these outcomes can partly incorporate the surrogate's signal. In the traces of the two leading agents, a few episodes compared candidate phenotypes by their strongest protein correlations, but none chose a phenotype by its number of protein associations.
The traces illustrate these measurement choices. For example, Opus 5 in heldout-hcm-01 derived a measure of contraction timing from the cine images and revised its extraction when the first version proved unstable. It then submitted cross-validated ridge predictions of a composite of observable cardiac indicators, which earned full phenotype credit (Supplementary Note S3).
4.3 The leading agents based nominations on genetic instruments, but no agent reliably rejected non-causal proteins
Opus 5 and GPT-5.6 Sol based most final nominations on cis Mendelian randomization and usually checked instrument strength, yet no agent averaged more than 2.87 of 15 points for bias identification, which requires rejecting non-causal proteins with the correct source of bias.
After constructing a disease phenotype, agents faced the second judgment, distinguishing proteins merely associated with the phenotype from those with evidence of a causal link. Executed IV analyses, including Mendelian randomization, were detected in 41 of 60 Opus 5 episodes and 29 of 60 GPT-5.6 Sol episodes, compared with 15 episodes across the other seven models.
A separate trajectory annotation, which applies a broader criterion than the static code audit (Section 3.6), showed that the leading and lower-ranked agents prioritized targets differently. Opus 5 based its final nominations primarily on cis Mendelian randomization in 57 of 60 episodes and GPT-5.6 Sol in 50, and the two agents checked instrument strength in 59 and 57 episodes, respectively (Supplementary Table S8A). In contrast, Haiku 4.5, GPT-OSS-20B, and Qwen3-Coder-30B-A3B relied predominantly on marginal association and correlation-based screening (Supplementary Note S3). Instrument strength does not, however, establish the exclusion restriction, the requirement that the genetic instrument affects disease only through the protein. Moreover, with a single cis instrument per protein (Section 3.1), agents could not test this requirement by comparing estimates across independent instruments.
Although the leading agents differed in which analysis methods they used, no analysis family was associated with outcomes after correction for multiple testing. For example, GPT-5.6 Sol used cross-molecular operations, which combine at least two of the proteomic, transcriptomic, and metabolomic layers, more often than Opus 5 (57 versus 38 of 60 episodes, Supplementary Note S3). Across all agents, however, none of the six analysis families defined by the code audit (Section 3.6) was associated with target recall or with the fraction of incorrect nominations after Holm correction across 12 exploratory tests.
The leading agents differed from the weaker agents in how they revised their hypotheses. Nearly all revisions by Opus 5 and GPT-5.6 Sol followed new evidence and narrowed the candidate set, whereas several smaller models formed an early hypothesis and did not revisit it. Consistent with this narrowing, the two leading agents nominated 3.7 and 3.1 proteins per episode, close to the two to six causal drivers planted in each non-null world, whereas in a few episodes weaker models submitted far longer lists (Supplementary Table S8B and Supplementary Note S3). One episode illustrates this narrowing. In heldout-hfpef-02, GPT-5.6 Sol knocked down both members of a pair that shared a genetic instrument. It then nominated only the member whose knockdown changed the outcomes, and the episode scored 83.01.
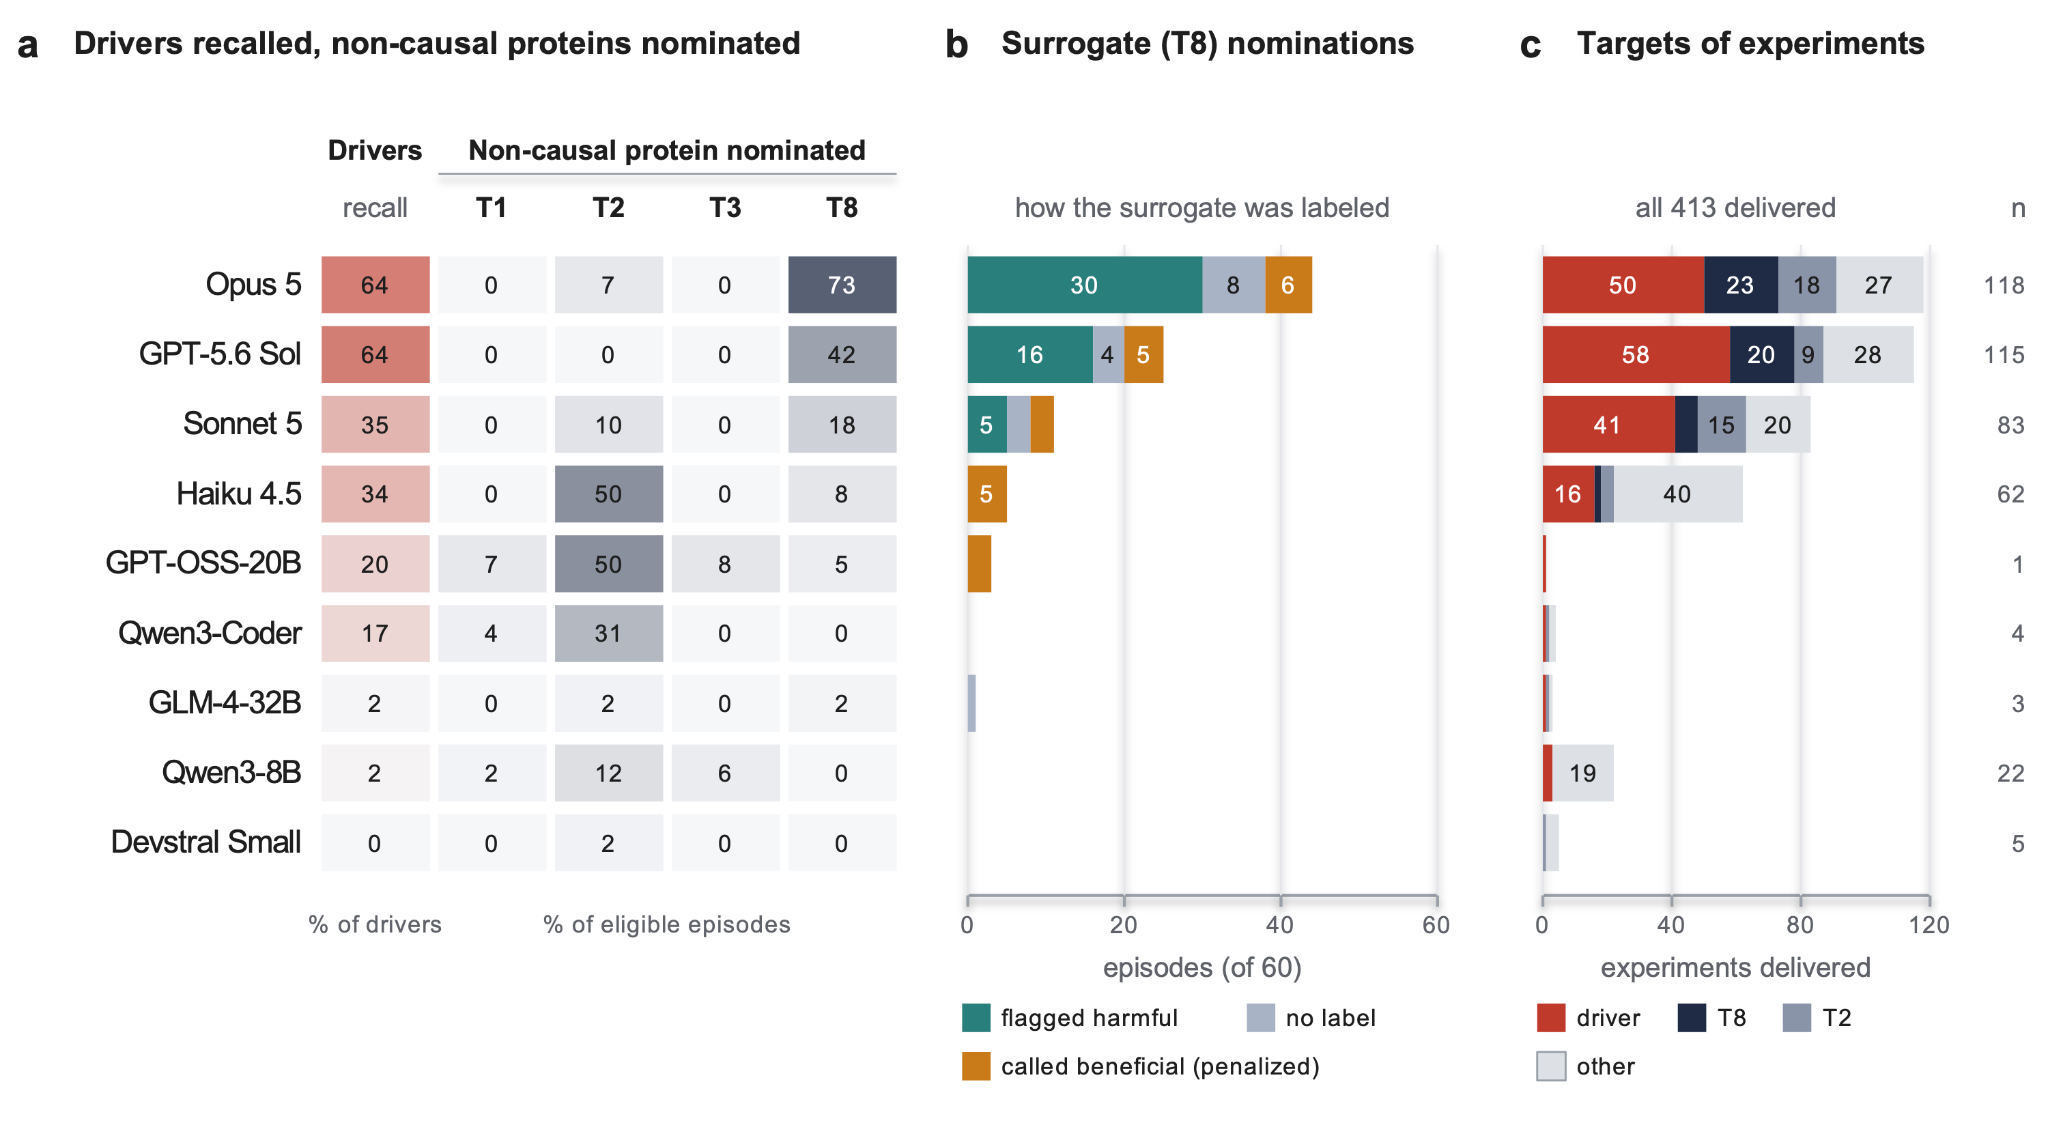
The low bias-identification scores reflected how rarely non-causal proteins were rejected with the correct source of bias. The reverse-causation (T2) protein, which agents rejected most often, was rejected without being nominated in 121 of the 378 episodes from the 14 worlds that contain this protein (32.0%), and 54 (14.3%) also named the correct source of bias, including 31 of 42 Opus 5 and 4 of 42 GPT-5.6 Sol episodes. Because the bias-identification score multiplies the recall of correct rejections by their precision, additional incorrect rejections further lowered it.
Agents also differed in which planted proteins they nominated, and the pattern varied by bias and by model (Figure 5a). All models nominated the confounding (T1) and selection (T3) proteins in fewer than 9% of the episodes from worlds that contain them, whereas the reverse-causation (T2) protein was nominated in half of such Haiku 4.5 and GPT-OSS-20B episodes. The harmful surrogate (T8) was nominated most often by the leading agents, in 44 of 60 Opus 5 and 25 of 60 GPT-5.6 Sol episodes. However, these agents usually labeled it as harmful to outcomes (30 of 44 and 16 of 25 nominations, respectively), which avoided the safety penalty although each nomination still counted as a false positive. By contrast, every surrogate nomination by Haiku 4.5 and GPT-OSS-20B claimed it was beneficial and therefore incurred the penalty (Figure 5b).
4.4 The leading agents tested pairs that shared a genetic instrument, but no agent tested a delayed-effect pair, and the expanded budget did not detectably change their scores
Where observational data could not separate two candidates because they shared a genetic instrument, the leading agents tested the causal member experimentally in 14 of 24 eligible episodes. However, no experiment targeted a delayed-effect pair, and the expanded ($2 million) budget did not detectably change the scores of the leading agents.
Experimental access bore on the third judgment, whether a claim was sufficiently supported, because it allowed agents to test directly the candidates and uncertainties that the observational analyses had left unresolved. Of the 360 episodes with an experimental budget, 143 received at least one experiment, and 413 experiments were delivered in total, most of them in vivo knockdowns (Supplementary Table S9 and Supplementary Note S3). Experimental use was concentrated in the three highest-scoring agents. Opus 5, GPT-5.6 Sol, and Sonnet 5 accounted for 316 of the deliveries (76.5%) but represented only one third of the budget-eligible episodes.
The targets of these experiments show which uncertainties agents chose to resolve. Of the 413 experiments, 171 (41.4%) targeted a causal driver, 52 (12.6%) the T8 harmful surrogate, 49 (11.9%) the reverse-causation (T2) protein, one each the confounding (T1) and selection (T3) proteins, and 139 (33.7%) other proteins (Figure 5c). Twenty-five experiments (6.1%) targeted a member of an ambiguous pair, all in the six worlds with a T4 pair, whose members share a genetic instrument. In these six worlds, Opus 5 and GPT-5.6 Sol tested the causal member in 14 of 24 eligible episodes (six worlds, two agents, and two budget conditions). Moreover, every causal driver that these two agents tested and nominated carried the intervention direction implied by its knockdown. In contrast, no experiment targeted either member of the 15 delayed-effect pairs, in which the causal member acts mainly over follow-up and which a cell perturbation cannot detect, and only one of 405 eligible episodes nominated such a causal driver.
When results were returned, agents usually read them. Among the 143 episodes that received at least one experiment, later code referred back to the returned result in 124 (86.7%), and 84 (58.7%) changed their conclusion. Of the 19 episodes that did not refer back, 16 had requested the experiment in the same turn as their final submission, so the episode ended before the result arrived, even though the instructions had invited revisions of a provisional submission (Section 3.3). Reading a result did not, however, guarantee that it was used correctly. Smaller models (Haiku 4.5, Qwen3-8B, and Devstral Small) nominated a total of 25 proteins whose knockdown had shown no effect. In addition, agents misread the format of the returned results in 16 of these 143 episodes, most of them from smaller models (Supplementary Note S3).
Budget effects were heterogeneous and not uniformly positive. In the 17 worlds containing an unidentifiable pair, observational-only totals are capped at 92.5. This cap, however, lies far above the mean score of every agent. Pooled mean scores were 13.11, 12.77, and 16.28 under the observational-only, limited, and expanded budgets (Figure 4b). Relative to the observational-only budget, the expanded budget increased the mean score of Opus 5 by 0.13 points and that of GPT-5.6 Sol by 0.07 points, with intervals spanning both gains and losses, whereas larger gains were observed in lower-ranked models (Supplementary Table S6). However, GPT-OSS-20B and Qwen3-Coder-30B-A3B received only one and four experiments, respectively, so their gains cannot be attributed to experimental evidence. For the leading agents, in turn, the small change did not reflect unused funds. Under the expanded budget, Opus 5 and GPT-5.6 Sol bought experiments in 19 of 20 episodes each and spent 93% and 95% of the available funds, and about half of these experiments targeted a causal driver. Their recall of causal drivers nevertheless stayed close to its observational-only level, at 0.65 and 0.60 compared with 0.64 for both.
4.5 Failures arose at several workflow steps, and correct answers did not always reflect supporting analysis
Agents failed at several steps of the research workflow, from phenotype construction to evidence use and code execution, and the three 75-point episodes that recovered the exact set of causal drivers differed widely in the reasoning behind their answers.
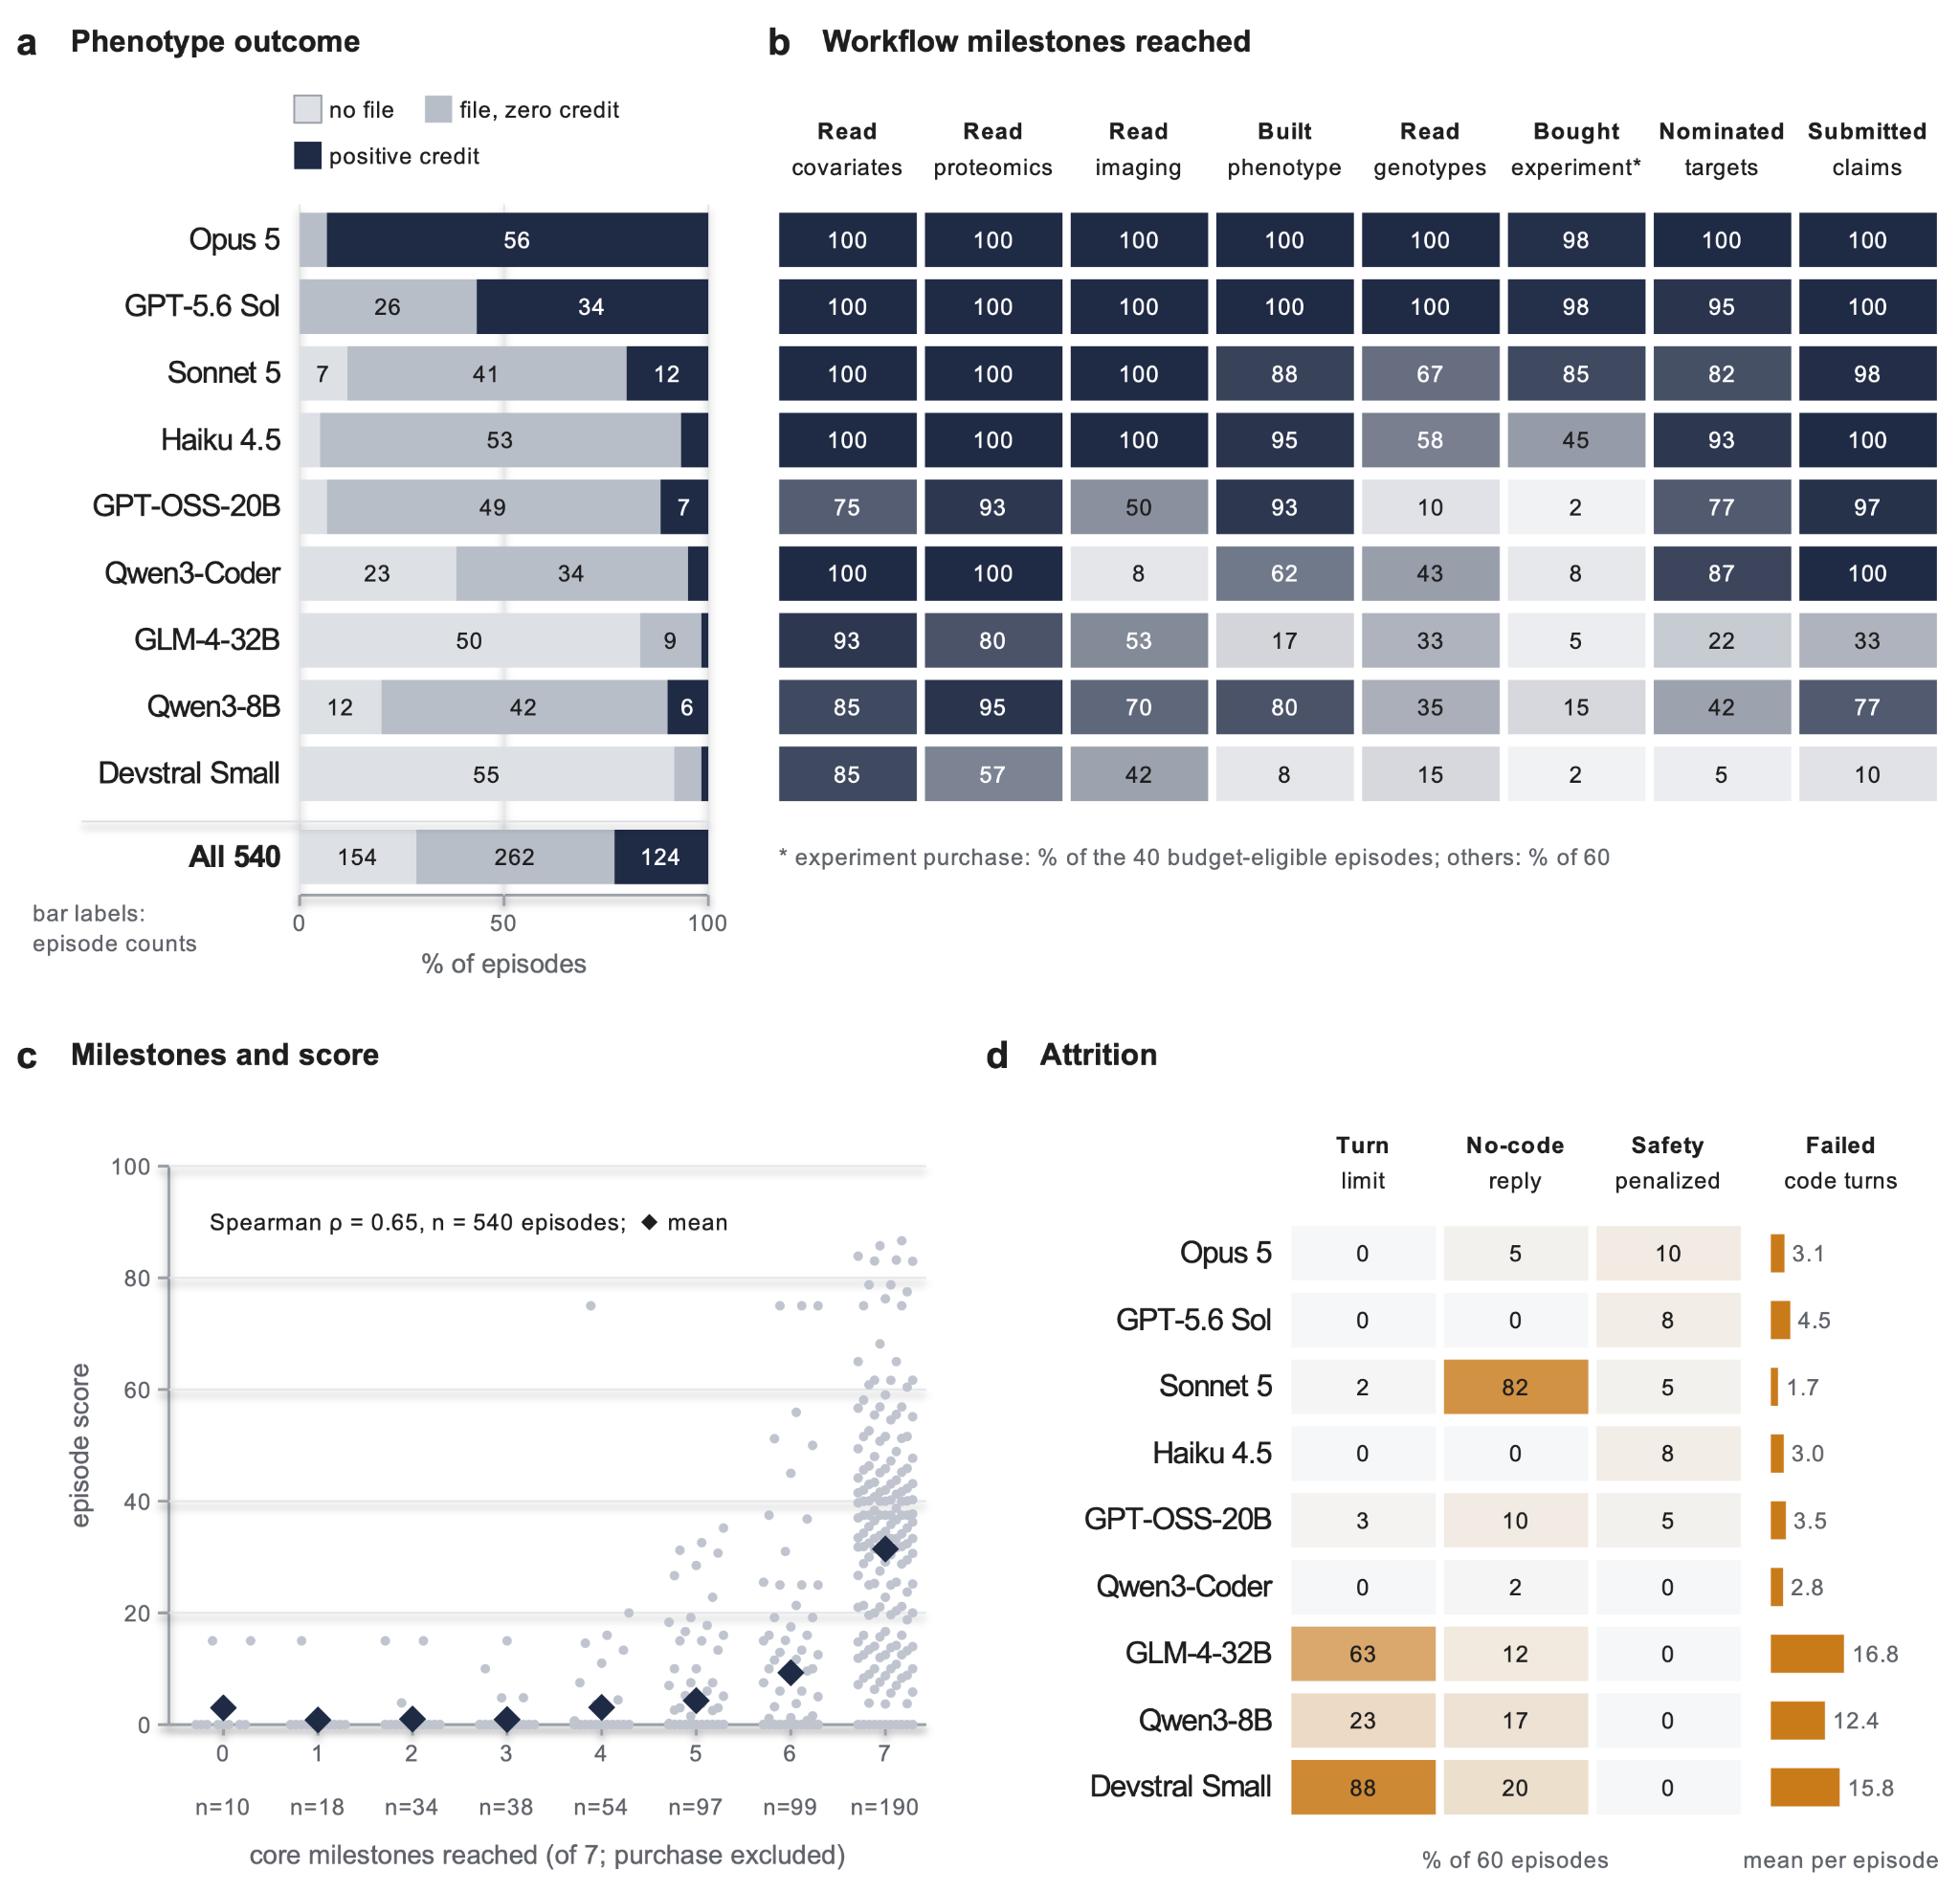
The first failure occurred in phenotype construction, where a zero score can conflate several distinct problems. Phenotype construction received zero credit in 416 of 540 episodes (77.0%, Figure 6a). In 154 of them, the agent did not produce a phenotype at the required submission path, and in the other 262 it produced a phenotype that earned no credit, which can reflect validity failures, low correlation with latent disease severity, or failure to exceed the recorded baseline (Supplementary Note S3). However, causal confidence and bias identification were zero more often, and phenotype construction was not the largest source of lost points (Figure 4c).
A second failure was that agents generated evidence but did not use it. In the qualitative trajectory audit, some agents executed an analysis but neither cited its result in the final rationale nor revised the candidate set. For example, Opus 5 and GPT-5.6 Sol accessed genotypes in all 60 episodes (Figure 6b), but IV analyses were detected in only 41 and 29 of them, respectively (Section 4.3). Similarly, GLM-4-32B accessed genotypes in 20 episodes without any detected IV analysis. This failure mode was more frequent in smaller models. Haiku 4.5, for instance, purchased experiments in 18 of its 40 eligible episodes, and its code referred back to a returned result in 11 of those 18.
A third failure, particularly in smaller models, occurred in code execution. Several smaller models generated code that referenced nonexistent column names. Devstral Small reached the 30-turn limit in 53 of 60 episodes, repeatedly reloading and re-deriving information rather than maintaining its progress across turns (Figure 6d, Supplementary Note S3). These behaviors consumed turns that could otherwise have been used for scientific analysis.
Finally, correct final answers did not always reflect supporting analysis. Three selected episodes scored 75 and recovered the exact planted set of causal drivers. In the Haiku 4.5 episode, the final submission cited knockdown responses as evidence. By contrast, GPT-OSS-20B and Qwen3-Coder-30B-A3B recovered the same set after correlation-based screening, and both hard-coded "aligned" outcome-alignment labels, while GPT-OSS-20B also hard-coded intervention directions. Nevertheless, all three received full causal-confidence and intervention-direction credit, because the score evaluates final claims rather than the analyses behind them. More generally, across the 540 episodes, the number of core workflow milestones reached (of seven) correlated with the score (Spearman ρ = 0.649; Figure 6c), but this relationship is confounded by model identity and is partly mechanical.
5. Discussion
Here we introduce a framework for generating synthetic biomedical worlds in which end-to-end drug target discovery can be evaluated against a known causal ground truth. Each world is generated from a hidden causal model that jointly specifies genetic variation, molecular measurements, latent disease severity, multimodal clinical phenotypes, longitudinal outcomes and responses to intervention. This not only produces a synthetic dataset, but also an environment in which the causal drivers of disease, the processes that generate misleading evidence and the effects of intervention are known by construction but concealed from the agent. By varying these underlying causal structures across worlds, the framework can generate progressively more difficult discovery problems while retaining an exact answer against which each stage of the research process can be evaluated.
Using this environment, we find that the leading agents executed the individual analyses of a biobank-based target study without a prescribed pipeline. The leading agents constructed disease phenotypes from raw cardiac images, tested causal claims with genetic instruments, revised their hypotheses as evidence accumulated, used limited budgets to conduct simulated follow-up experiments, and recovered nearly two-thirds of the causal drivers. However, they rarely integrated these analyses into a correct and well-supported conclusion, and their performance was limited less by the analyses themselves than by the judgments that connect them, namely how to measure the disease, which evidence separates a causal driver from a non-causal protein, and when a claim is sufficiently supported. Because each of these judgments is scored separately against a known causal structure, DrugTargetWorld can attribute an agent's errors to specific stages of its analysis rather than only to its final answer.
Existing benchmarks (Chen, 2025; Koch, 2026; Li & Ho, 2026; Majumder et al., 2024; Mitchener et al., 2025; Xi et al., 2025) typically specify the research question and therefore rarely test these judgments, and agentic systems such as Kosmos (Mitchener et al., 2025b), the Virtual Biotech, and Biomni cannot yet be scored against the causal structure of the data they analyze. Such systems could be evaluated in the same worlds, where every final claim is scored against a known causal structure and anonymized protein identifiers (Section 3.2) confine the evaluation to what they infer from the data.
The first judgment, how to measure the disease, most clearly separated the two leading agents. Opus 5 and GPT-5.6 Sol had similar recall of causal drivers (0.64), and without phenotype credit the gap between their total scores narrowed from 4.6 to 0.9 points. The strongest phenotypes combined several imaging features, some weighted by clinical outcomes, and almost all were checked against other disease signals in the dataset. In the traces of the leading agents, none was chosen for its number of protein associations (Section 4.2). This pattern is consistent with biobank studies in which phenotype construction shapes statistical power and genetic discovery (An et al., 2023) .
This result raises the prior question of how disease should be measured from multimodal biobank data. DrugTargetWorld answers it by design, scoring agreement with a single latent disease severity, but clinical medicine has no such reference point. Disease categories have been defined by presentation, organ, and consensus rather than by mechanism (Loscalzo et al., 2007), as the ejection-fraction thresholds that divide heart failure illustrate (Bozkurt et al., 2021). Nor do statistical criteria settle the matter, because broader definitions can strengthen genetic associations while capturing less of the intended disease (Cai et al., 2020), and prognostic phenotypes may reflect severity or non-causal markers rather than mechanism (Riley et al., 2013). Our worlds reproduce this tension, since a phenotype tuned to protein associations could lean on reverse causation (T2), and one tuned to clinical events could partly import the harmful surrogate. In real biobanks, moreover, diseases coexist and vary between patients (Shah et al., 2015), and data-driven phenotypes can reveal heritable structure that clinical labels miss (Yun et al., 2024). A phenotype designed by an agent that departs from a reference definition is therefore not necessarily wrong. In version 1, by contrast, a phenotype unrelated to the single latent severity carries little causal-driver signal, so such a departure is penalized by design. Version 2 will address this limitation by incorporating coexisting disease phenotypes, some outside the cardiovascular domain.
The second judgment, which evidence separates a causal driver from a non-causal protein, was only partly met. The leading agents based most nominations on cis genetic instruments and checked instrument strength, partly resembling established target prioritization, which combines Mendelian randomization, colocalization, cross-omic concordance, and perturbation data (Henry et al., 2022; Rasooly et al., 2023, 2025; Sanderson et al., 2022) . Because the generator assigns each protein a single cis instrument, however, estimates could not be compared across independent instruments. Moreover, after correction for multiple testing, no analysis family that agents used was associated with target recall or with incorrect nominations. Bias-identification scores stayed low because agents rarely rejected non-causal proteins other than the reverse-causation (T2) protein and diluted correct rejections with incorrect ones. The harmful surrogate exposed the same gap, because the leading agents nominated it in 44 and 25 of 60 episodes, usually labeling it harmful to outcomes without concluding that it was not a causal driver.
The third judgment, when a claim is sufficiently supported, rested largely on experiments, because in this environment a single knockdown settles the causal status of any protein other than the harmful surrogate, which made experiments most valuable for candidates that observational data could not resolve. The leading agents used experiments effectively when a pair shared a genetic instrument, testing the causal member in 14 of 24 eligible episodes, and every driver they tested and nominated carried the intervention direction implied by its knockdown. By contrast, pairs whose causal member acts mainly over follow-up were never tested. Consistent with this, the expanded budget did not detectably change the scores of the leading agents, and their remaining errors appear to lie mostly in candidates never identified. The exceptions were two GPT-5.6 Sol episodes under the $2 million budget that ended on an empty provisional submission one turn after delivery, before the agent had seen its knockdown results. Smaller models, on the other hand, often bought experiments too late to read them or nominated proteins whose knockdown had shown no effect (Section 4.4).
These failure modes suggest harness changes that controlled ablations can test. Scaffolds could guide phenotype construction and track evidence, while prompts could require each experimental result to update or close an open question and submission could wait for pending results. Freshly generated worlds, each with its own ground truth, can also supply a verifiable reward for training agents across the entire workflow, an approach that has already improved agents in other interactive environments (Liévin et al., 2026; Narayanan et al., 2024) . An outcome-based score can, however, credit answers that lack supporting analysis (Section 4.5), so a training reward should be paired with trajectory annotation and exploit audits. Smaller open-weight models, which scored zero in 78% of episodes, will likely need denser intermediate rewards or a curriculum of easier worlds.
This study has several limitations. The worlds are synthetic, calibrated to TOPMed MESA data only for selected population, imaging, genetic, protein missing-data, and event-rate summaries (Supplementary Methods S1.1), and their mostly linear mechanisms, effect sizes, and biases were designed rather than estimated from real disease. This limitation is inherent to any synthetic world with a known ground truth, whereas the remaining ones concern this evaluation and can be addressed in future versions. Each model ran once per world and budget, leaving run-to-run variation unmeasured, and the two human-guided episodes were exploratory references rather than a matched baseline. The minimal harness may also underestimate what optimized agent systems would achieve. Because the score evaluates final claims, hard-coded labels can earn credit (Section 4.5). The environment can also be exploited through the knockdown, which returns exactly zero for every non-causal protein except the harmful surrogate, unlike any real experiment, and through a phenotype tuned to the reverse-causation (T2) protein, which would earn credit without causal reasoning. Moreover, the prompt told agents in every world, including the null world, that a small number of proteins drive disease, and invited revisions of provisional submissions that the harness treated as final (Supplementary Methods S2.4). Phenotype scores were computed on a random 20% of participants, so a phenotype built only from cardiac MRI was scored on about 2,060 to 2,280 imaged participants, less precisely than one defined for the whole cohort. Finally, a data-generation error rendered follow-up MRI with DCM morphology in the 14 non-DCM worlds, including 9 of the 15 worlds whose delayed effects appear mainly on follow-up imaging. Excluding affected reads did not change the order of the leading agents (Supplementary Table S11D), although all six episodes above 80 points fell in excluded cells.
These limitations define the next iterations of the benchmark. Repeated episodes for each agent, world, and budget will measure run-to-run variation, and repeated episodes by independent human investigators will provide a baseline. Several human experts, together with agents using literature-search tools such as Paperclip, will annotate trajectories, distinguishing workflows a biostatistician would recognize from less conventional ones. Because the reward depends on the outcome, unconventional or more efficient pipelines that recover the ground truth still earn credit, so the benchmark may also support method discovery. Such pipelines will become candidate methods once their novelty is established and their frozen versions succeed on unseen worlds and in real cohorts.
The ultimate aim is to transfer what agents learn in simulation to real biobanks, which requires greater realism and a bridge to real data. Future worlds will include more causal drivers per disease, nonlinear and interacting effects, coexisting cardiovascular and non-cardiovascular conditions, and subtypes not captured by current guidelines, and each will be audited for exploitable cues. Pairing each biobank with simulated single-cell expression data and perturbation screens will require agents, like investigators, to combine evidence across incomplete sources. Following the injection-and-recovery design of the Kepler planet survey (Christiansen et al., 2015), known protein-to-phenotype effects can then be implanted into real biobank data, with planted non-causal proteins and permuted copies as known nulls. Agents can also be asked to recover causal relationships in MESA and UK Biobank that are supported by experimental evidence published after their training cutoff.
In summary, current AI agents can perform most of the individual analyses in biobank-based drug target discovery but do not yet reliably make the judgments that turn them into well-supported causal claims. By making these judgments measurable against a known ground truth, DrugTargetWorld offers both a benchmark for this capability and a verifiable reward with which agents can be trained to acquire it.
Author contributions
B.G. conceived the study. S.M. and B.G. developed the methodology and benchmark design. S.M., B.G., A.H., E.C., I.B., A.S., and F.C. led software development and implementation. S.M. led the experimental evaluation, formal analysis, and visualization. B.G., P.S., and E.A. provided scientific and methodological guidance. S.M. wrote the original manuscript, and P.S., B.V., S.R., R.X., J.O., D.K., and M.W. contributed to its writing and editing. All authors reviewed and edited the manuscript. B.G. supervised the work.
Acknowledgements
We thank Bailey Bova and Brittney Tong of Anthropic for their support through Anthropic's AI for Science program.
MESA data were obtained through the NIH database of Genotypes and Phenotypes (dbGaP; phs000209.v13.p3 and phs001416.v4.p1). Whole genome sequencing (WGS) for the Trans-Omics in Precision Medicine (TOPMed) program was supported by the National Heart, Lung and Blood Institute (NHLBI). WGS for “NHLBI TOPMed: Multi-Ethnic Study of Atherosclerosis (MESA)” (phs001416.v4.p1) was performed at the Broad Institute of MIT and Harvard (3U54HG003067-13S1). Centralized read mapping and genotype calling, along with variant quality metrics and filtering were provided by the TOPMed Informatics Research Center (3R01HL-117626-02S1, contract HHSN268201800002I) (Proteomics HHSN268201600034I). Phenotype harmonization, data management, sample-identity QC, and general study coordination, were provided by the TOPMed Data Coordinating Center (3R01HL-120393; U01HL-120393; contract HHSN268201800001I). MESA and the MESA SHARe projects are conducted and supported by the National Heart, Lung, and Blood Institute (NHLBI) in collaboration with MESA investigators. Support for MESA is provided by contracts 75N92020D00001, HHSN268201500003I, N01-HC-95159, 75N92020D00005, N01-HC-95160, 75N92020D00002, N01-HC-95161, 75N92020D00003, N01-HC-95162, 75N92020D00006, N01-HC-95163, 75N92020D00004, N01-HC-95164, 75N92020D00007, N01-HC-95165, N01-HC-95166, N01-HC-95167, N01-HC-95168, N01-HC-95169, UL1-TR-000040, UL1-TR-001079, and UL1-TR-001420. The authors thank the MESA participants and the MESA investigators and staff for their valuable contributions. A full list of participating MESA investigators and institutions can be found at http://www.mesa-nhlbi.org.
Competing interests
E.A. reports advisory roles with Pacific Biosciences; ownership interests in Personalis, Deepcell, Svexa, Candela, Parameter Health, Saturnus Bio, and Swift Bio; and serves as a non-executive director of AstraZeneca and Dexcom. The remaining authors declare no competing interests.
Funding
This work was supported in part by Anthropic's AI for Science program, which provided computational resources and model usage credits. We also acknowledge the following financial support: American Heart Association Career Development Award (26CDA1589055, to B.G.).
Ethics statement
DrugTargetWorld generates synthetic participant-level worlds. Calibration used cohort-level summary statistics computed from MESA data obtained through dbGaP (phs000209 and phs001416), together with published MESA reports, and ACDC anatomical templates for MRI rendering (Supplementary Methods S1.1). These were group-level statistics only: counts, means, standard deviations, proportions, correlations, distribution quantiles, and simple model summaries such as covariate R². No MESA participant rows, identifiers, genotypes, or assay values were redistributed, and no real participant was resampled into any world. The two human-guided reference episodes, each conducted by an author, involved no research participants. PROT_ and TRANS_ identifiers are generated from integer indices and have no real gene or protein mapping; nominations therefore make no claim about an actual drug molecule. The scorer applies a 30-point penalty when the planted harmful surrogate (a clinically adverse target) is nominated as outcome-aligned. Releasing evaluation worlds and ground truth creates a risk of future training contamination; the generator permits evaluation on newly sampled seeds, and the separation of development and evaluation worlds will be documented for each subsequent panel.
AI use statement
The authors (S.M.) wrote the first draft of the manuscript. Speech to text software Wispr was used for direct dictation of the manuscript. Both ChatGPT (OpenAI) and Claude (Anthropic) were used for minor language and formatting assistance. Grammarly was used for minor editing and grammar. All authors reviewed and approved the manuscript and take full responsibility for its content. No other writing assistance was provided or paid for.
The nine AI agents generated the analysis code and, where produced, submission files in the 540 canonical episodes. Supplementary Notes S1 and S2 separately report the two human-guided episodes, in which an investigator directed a language model, and only the episode in Supplementary Note S2 followed the standard evaluation protocol. AI assistants were also used to help edit the manuscript, inspect source code and archived trajectories, and develop the audit and sensitivity scripts reported here. The inspected records do not provide a complete history of AI assistance during the original generator and harness development. AI-assisted static-code classifications are treated as measurements with possible error, rather than independent expert judgments. The authors retain responsibility for the manuscript and its scientific claims.
Code and data availability
DrugTargetWorld code is publicly available at https://github.com/sammargolis/DrugTargetWorld/. The project website is available at https://DrugTargetWorld.vercel.app/. Benchmark assets and released datasets are available at https://huggingface.co/datasets/sammargolis/DrugTargetWorld-assets.
References
Abifadel, M., Varret, M., Rabès, J.-P., Allard, D., Ouguerram, K., Devillers, M., Cruaud, C., Benjannet, S., Wickham, L., Erlich, D., Derré, A., Villéger, L., Farnier, M., Beucler, I., Bruckert, E., Chambaz, J., Chanu, B., Lecerf, J.-M., Luc, G., … Boileau, C. (2003). Mutations in PCSK9 cause autosomal dominant hypercholesterolemia. Nature Genetics , 34 (2), 154–156. https://doi.org/10.1038/ng1161
An, U., Pazokitoroudi, A., Alvarez, M., Huang, L., Bacanu, S., Schork, A. J., Kendler, K., Pajukanta, P., Flint, J., Zaitlen, N., Cai, N., Dahl, A., & Sankararaman, S. (2023). Deep learning-based phenotype imputation on population-scale biobank data increases genetic discoveries. Nature Genetics , 55 (12), 2269–2276. https://doi.org/10.1038/s41588-023-01558-w
Aung, N., Lopes, L. R., Van Duijvenboden, S., Harper, A. R., Goel, A., Grace, C., Ho, C. Y., Weintraub, W. S., Kramer, C. M., Neubauer, S., Watkins, H. C., Petersen, S. E., & Munroe, P. B. (2023). Genome-Wide Analysis of Left Ventricular Maximum Wall Thickness in the UK Biobank Cohort Reveals a Shared Genetic Background With Hypertrophic Cardiomyopathy. Circulation: Genomic and Precision Medicine , 16 (1). https://doi.org/10.1161/CIRCGEN.122.003716
Aung, N., Vargas, J. D., Yang, C., Fung, K., Sanghvi, M. M., Piechnik, S. K., Neubauer, S., Manichaikul, A., Rotter, J. I., Taylor, K. D., Lima, J. A. C., Bluemke, D. A., Kawut, S. M., Petersen, S. E., & Munroe, P. B. (2022). Genome-wide association analysis reveals insights into the genetic architecture of right ventricular structure and function. Nature Genetics , 54 (6), 783–791. https://doi.org/10.1038/s41588-022-01083-2
Bycroft, C., Freeman, C., Petkova, D., Band, G., Elliott, L. T., Sharp, K., Motyer, A., Vukcevic, D., Delaneau, O., O’Connell, J., Cortes, A., Welsh, S., Young, A., Effingham, M., McVean, G., Leslie, S., Allen, N., Donnelly, P., & Marchini, J. (2018). The UK Biobank resource with deep phenotyping and genomic data. Nature , 562 (7726), 203–209. https://doi.org/10.1038/s41586-018-0579-z
Chen, Z. (2025). ScienceAgentBench: Toward Rigorous Assessment of Language Agents for Data-Driven Scientific Discovery . International Conference on Learning Representations. https://arxiv.org/abs/2410.05080
Chen, Z., Chen, Y., Liu, C., Yu, J., Song, X., Li, Z., Li, J., Torr, P., Han, B., & Zhang, K. (2026). CausalGame: Benchmarking Causal Thinking of LLM Agents in Games . International Conference on Machine Learning. https://doi.org/10.48550/arXiv.2607.04293
Cobbe, K., Hesse, C., Hilton, J., & Schulman, J. (2020). Leveraging Procedural Generation to Benchmark Reinforcement Learning . 119 , 2048–2056.
Cohen, J. C., Boerwinkle, E., Mosley, T. H., & Hobbs, H. H. (2006). Sequence Variations in PCSK9, Low LDL, and Protection against Coronary Heart Disease. New England Journal of Medicine , 354 (12), 1264–1272. https://doi.org/10.1056/NEJMoa054013
Duffy, Á., Petrazzini, B. O., Stein, D., Park, J. K., Forrest, I. S., Gibson, K., Vy, H. M., Chen, R., Márquez-Luna, C., Mort, M., Verbanck, M., Schlessinger, A., Itan, Y., Cooper, D. N., Rocheleau, G., Jordan, D. M., & Do, R. (2024). Development of a human genetics-guided priority score for 19,365 genes and 399 drug indications. Nature Genetics , 56 (1), 51–59. https://doi.org/10.1038/s41588-023-01609-2
Ference, B. A., Robinson, J. G., Brook, R. D., Catapano, A. L., Chapman, M. J., Neff, D. R., Voros, S., Giugliano, R. P., Davey Smith, G., Fazio, S., & Sabatine, M. S. (2016). Variation in PCSK9 and HMGCR and Risk of Cardiovascular Disease and Diabetes. New England Journal of Medicine , 375 (22), 2144–2153. https://doi.org/10.1056/NEJMoa1604304
Fortin, J.-P., Cullen, N., Sheline, Y. I., Taylor, W. D., Aselcioglu, I., Cook, P. A., Adams, P., Cooper, C., Fava, M., McGrath, P. J., McInnis, M., Phillips, M. L., Trivedi, M. H., Weissman, M. M., & Shinohara, R. T. (2018). Harmonization of cortical thickness measurements across scanners and sites. NeuroImage , 167 , 104–120. https://doi.org/10.1016/j.neuroimage.2017.11.024 Gomes, B., Singh, A., O’Sullivan, J. W., Schnurr, T. M., Goddard, P. C., Loong, S., Amar, D., Hughes, J. W., Kostur, M., Haddad, F., Salerno, M., Foo, R., Montgomery, S. B., Parikh, V. N., Meder, B., & Ashley, E. A. (2024). Genetic architecture of cardiac dynamic flow volumes. Nature Genetics , 56 (2), 245–257. https://doi.org/10.1038/s41588-023-01587-5
Gong, W., Bai, S., Zheng, Y.-Q., Smith, S. M., & Beckmann, C. F. (2023). Supervised Phenotype Discovery From Multimodal Brain Imaging. IEEE Transactions on Medical Imaging , 42 (3), 834–849. https://doi.org/10.1109/TMI.2022.3218720
Gong, W., Beckmann, C. F., & Smith, S. M. (2021). Phenotype discovery from population brain imaging. Medical Image Analysis , 71 , 102050. https://doi.org/10.1016/j.media.2021.102050
Guo, D., Yang, D., Zhang, H., Song, J., Wang, P., Zhu, Q., Xu, R., Zhang, R., Ma, S., Bi, X., Zhang, X., Yu, X., Wu, Y., Wu, Z. F., Gou, Z., Shao, Z., Li, Z., Gao, Z., Liu, A., … Zhang, Z. (2025). DeepSeek-R1 incentivizes reasoning in LLMs through reinforcement learning. Nature , 645 (8081), 633–638. https://doi.org/10.1038/s41586-025-09422-z
Heckbert, S. R., Post, W., Pearson, G. D. N., Arnett, D. K., Gomes, A. S., Jerosch-Herold, M., Hundley, W. G., Lima, J. A., & Bluemke, D. A. (2006). Traditional Cardiovascular Risk Factors in Relation to Left Ventricular Mass, Volume, and Systolic Function by Cardiac Magnetic Resonance Imaging. Journal of the American College of Cardiology , 48 (11), 2285–2292. https://doi.org/10.1016/j.jacc.2006.03.072
Henry, A., Gordillo-Marañón, M., Finan, C., Schmidt, A. F., Ferreira, J. P., Karra, R., Sundström, J., Lind, L., Ärnlöv, J., Zannad, F., Mälarstig, A., Hingorani, A. D., Lumbers, R. T., & HERMES and SCALLOP Consortia. (2022). Therapeutic Targets for Heart Failure Identified Using Proteomics and Mendelian Randomization. Circulation , 145 (16), 1205–1217. https://doi.org/10.1161/CIRCULATIONAHA.121.056663
Huang, K., Zhang, S., Wang, H., Qu, Y., Lu, Y., Li, R., Roohani, Y., Qiu, L., Cao, S., Li, G., Zhang, J., Yin, D., Wierenga, R., Kavi, D., Liu, S., She, T., Marwaha, S., Carter, J. N., Zhou, X., … Leskovec, J. (2026). Autonomous biomedical research with an artificial intelligence agent. Science , 393 (6813), eadz4351. https://doi.org/10.1126/science.adz4351
Hubert, T., Mehta, R., Sartran, L., Horváth, M. Z., Žužić, G., Wieser, E., Huang, A., Schrittwieser, J., Schroecker, Y., Masoom, H., Bertolli, O., Zahavy, T., Mandhane, A., Yung, J., Beloshapka, I., Ibarz, B., Veeriah, V., Yu, L., Nash, O., … Silver, D. (2026). Olympiad-level formal mathematical reasoning with reinforcement learning. Nature , 651 (8106), 607–613. https://doi.org/10.1038/s41586-025-09833-y
Jimenez, C. E., Yang, J., Wettig, A., Yao, S., Pei, K., Press, O., & Narasimhan, K. (2024). SWE-bench: Can Language Models Resolve Real-World GitHub Issues? (arXiv:2310.06770). arXiv. https://doi.org/10.48550/arXiv.2310.06770
Jin, Z., Chen, Y., Leeb, F., Gresele, L., Kamal, O., Lyu, Z., Blin, K., Gonzalez Adauto, F., Kleiman-Weiner, M., Sachan, M., & Schölkopf, B. (2023). CLadder: Assessing Causal Reasoning in Language Models . 36 , 31038–31065. https://doi.org/10.48550/arXiv.2312.04350
King, E. A., Davis, J. W., & Degner, J. F. (2019). Are drug targets with genetic support twice as likely to be approved? Revised estimates of the impact of genetic support for drug mechanisms on the probability of drug approval. PLOS Genetics , 15 (12), e1008489. https://doi.org/10.1371/journal.pgen.1008489
Koch, Z. (2026). BixBench3: Benchmarking AI agents on research-study-scale computational biology tasks . https://doi.org/10.48550/arXiv.2608.25286
Leban, A., & Sun, Y. (2026). CausalDS: Benchmarking Causal Reasoning in Data-Science Agents. arXiv . https://doi.org/10.48550/arXiv.2607.08093
Leek, J. T., Scharpf, R. B., Bravo, H. C., Simcha, D., Langmead, B., Johnson, W. E., Geman, D., Baggerly, K., & Irizarry, R. A. (2010). Tackling the widespread and critical impact of batch effects in high-throughput data. Nature Reviews Genetics , 11 (10), 733–739. https://doi.org/10.1038/nrg2825
Li, J. H., & Ho, A. J. (2026). GeneBench-Pro: Evaluating Multistage Statistical Reasoning in Genomics, Quantitative Biology, and Translational Biomedicine. bioRxiv . https://doi.org/10.64898/2026.06.29.735386
Liévin, V., Schmidgall, S., Strother, T., Bijamov, A., Goel, A., Palepu, A., Park, C., Balazadeh, V., Sun, M. W., Guerard, M., Chen, J., Steiner, D., Dhillon, V., Azar, I., Mehta, A., Spetsieris, N., Shah, S., Abdelrahim, M., Dahiya, A., … Yang, L. (2026). ResidencyRL: Reinforcement Learning in Simulated Clinical Environments (Version 1). arXiv. https://doi.org/10.48550/ARXIV.2608.07418
Lind, L., Mazidi, M., Clarke, R., Bennett, D. A., & Zheng, R. (2024). Measured and genetically predicted protein levels and cardiovascular diseases in UK Biobank and China Kadoorie Biobank. Nature Cardiovascular Research , 3 (10), 1189–1198. https://doi.org/10.1038/s44161-024-00545-6
Liu, C.-Y., Liu, Y.-C., Wu, C., Armstrong, A., Volpe, G. J., Van Der Geest, R. J., Liu, Y., Hundley, W. G., Gomes, A. S., Liu, S., Nacif, M., Bluemke, D. A., & Lima, J. A. C. (2013). Evaluation of Age-Related Interstitial Myocardial Fibrosis With Cardiac Magnetic Resonance Contrast-Enhanced T1 Mapping. Journal of the American College of Cardiology , 62 (14), 1280–1287. https://doi.org/10.1016/j.jacc.2013.05.078
Majumder, B. P., Surana, H., Agarwal, D., Mishra, B. D., Meena, A., Prakhar, A., Vora, T., Khot, T., Sabharwal, A., & Clark, P. (2024). DiscoveryBench: Towards Data-Driven Discovery with Large Language Models (Version 1). arXiv. https://doi.org/10.48550/ARXIV.2407.01725
Marques, M. D., Weinberg, R., Kapoor, S., Ostovaneh, M. R., Kato, Y., Liu, C. Y., Shea, S., McClelland, R. L., Post, W. S., Bluemke, D. A., Lima, J. A. C., & Ambale-Venkatesh, B. (2022). Myocardial fibrosis by T1 mapping magnetic resonance imaging predicts incident cardiovascular events and all-cause mortality: The Multi-Ethnic Study of Atherosclerosis. European Heart Journal - Cardiovascular Imaging , 23 (10), 1407–1416. https://doi.org/10.1093/ehjci/jeac010
Minikel, E. V., Painter, J. L., Dong, C. C., & Nelson, M. R. (2024). Refining the impact of genetic evidence on clinical success. Nature , 629 (8012), 624–629. https://doi.org/10.1038/s41586-024-07316-0
Mitchener, L., Laurent, J. M., Tenmann, B., Narayanan, S., Wellawatte, G. P., White, A., Sani, L., & Rodriques, S. G. (2025). BixBench: A Comprehensive Benchmark for LLM-based Agents in Computational Biology . https://doi.org/10.48550/arXiv.2503.00096
Mooij, J. M., Peters, J., Janzing, D., Zscheischler, J., & Schölkopf, B. (2016). Distinguishing Cause from Effect Using Observational Data: Methods and Benchmarks. Journal of Machine Learning Research , 17 (32), 1–102.
Munafò, M. R., Tilling, K., Taylor, A. E., Evans, D. M., & Davey Smith, G. (2018). Collider scope: When selection bias can substantially influence observed associations. International Journal of Epidemiology , 47 (1), 226–235. https://doi.org/10.1093/ije/dyx206
Narayanan, S., Braza, J. D., Griffiths, R.-R., Ponnapati, M., Bou, A., Laurent, J., Kabeli, O., Wellawatte, G., Cox, S., Rodriques, S. G., & White, A. D. (2024). Aviary: Training language agents on challenging scientific tasks. arXiv . https://doi.org/10.48550/arXiv.2412.21154
Nelson, M. R., Tipney, H., Painter, J. L., Shen, J., Nicoletti, P., Shen, Y., Floratos, A., Sham, P. C., Li, M. J., Wang, J., Cardon, L. R., Whittaker, J. C., & Sanseau, P. (2015). The support of human genetic evidence for approved drug indications. Nature Genetics , 47 (8), 856–860. https://doi.org/10.1038/ng.3314
Ochoa, D., Hercules, A., Carmona, M., Suveges, D., Baker, J., Malangone, C., Lopez, I., Miranda, A., Cruz-Castillo, C., Fumis, L., Bernal-Llinares, M., Tsukanov, K., Cornu, H., Tsirigos, K., Razuvayevskaya, O., Buniello, A., Schwartzentruber, J., Karim, M., Ariano, B., … McDonagh, E. M. (2023). The next-generation Open Targets Platform: Reimagined, redesigned, rebuilt. Nucleic Acids Research , 51 (D1), D1353–D1359. https://doi.org/10.1093/nar/gkac1046
OpenAI. (2026). On the Navier–Stokes Millennium Prize Problem . https://cdn.openai.com/pdf/32d9f210-8b73-45e0-91bc-82a30aef8a9a/navier-stokes.pdf
Pan, J., Wang, X., Neubig, G., Jaitly, N., Ji, H., Suhr, A., & Zhang, Y. (2025). Training Software Engineering Agents and Verifiers with SWE-Gym . 267 , 47717–47737.
Pun, F. W., Podolskiy, D., Izumchenko, E., Mortlock, A., Oprea, T. I., Scheibye-Knudsen, M., Fortney, K., Morgen, E., Ren, F., & Zhavoronkov, A. (2026). Target identification and assessment in the era of AI. Nature Reviews Drug Discovery , 25 (7), 534–552. https://doi.org/10.1038/s41573-026-01412-8
Rasooly, D., Giambartolomei, C., Peloso, G. M., Dashti, H., Ferolito, B. R., Golden, D., Horimoto, A. R. V. R., Pietzner, M., Farber-Eger, E. H., Wells, Q. S., Bini, G., Proietti, G., Tartaglia, G. G., Kosik, N. M., Wilson, P. W. F., Phillips, L. S., Munroe, P. B., Petersen, S. E., Cho, K., … Joseph, J. (2025). Large-scale multi-omics identifies drug targets for heart failure with reduced and preserved ejection fraction. Nature Cardiovascular Research , 4 (3), 293–311. https://doi.org/10.1038/s44161-025-00609-1
Rasooly, D., Peloso, G. M., Pereira, A. C., Dashti, H., Giambartolomei, C., Wheeler, E., Aung, N., Ferolito, B. R., Pietzner, M., Farber-Eger, E. H., Wells, Q. S., Kosik, N. M., Gaziano, L., Posner, D. C., Bento, A. P., Hui, Q., Liu, C., Aragam, K., Wang, Z., … Casas, J. P. (2023). Genome-wide association analysis and Mendelian randomization proteomics identify drug targets for heart failure. Nature Communications , 14 (1), 3826. https://doi.org/10.1038/s41467-023-39253-3
Reddy, S. G., Cao, F., Xia, R., Loong, S., Chen, E., Steffner, K., O’Sullivan, J. W., Haddad, F., Foo, R., Parikh, V. N., Wheeler, M. T., Ashley, E. A., & Gomes, B. (2025). Deep learning representations and proteome-wide Mendelian randomization identify causal mediators of myocardial fibrosis . Cardiovascular Medicine. https://doi.org/10.64898/2025.12.13.25342200
Replogle, J. M., Saunders, R. A., Pogson, A. N., Hussmann, J. A., Lenail, A., Guna, A., Mascibroda, L., Wagner, E. J., Adelman, K., Lithwick-Yanai, G., Iremadze, N., Oberstrass, F., Lipson, D., Bonnar, J. L., Jost, M., Norman, T. M., & Weissman, J. S. (2022). Mapping information-rich genotype-phenotype landscapes with genome-scale Perturb-seq. Cell , 185 (14), 2559-2575.e28. https://doi.org/10.1016/j.cell.2022.05.013
Sanderson, E., Glymour, M. M., Holmes, M. V., Kang, H., Morrison, J., Munafò, M. R., Palmer, T., Schooling, C. M., Wallace, C., Zhao, Q., & Davey Smith, G. (2022). Mendelian randomization. Nature Reviews Methods Primers , 2 (1), 6. https://doi.org/10.1038/s43586-021-00092-5
Smith, S. M., Douaud, G., Chen, W., Hanayik, T., Alfaro-Almagro, F., Sharp, K., & Elliott, L. T. (2021). An expanded set of genome-wide association studies of brain imaging phenotypes in UK Biobank. Nature Neuroscience , 24 (5), 737–745. https://doi.org/10.1038/s41593-021-00826-4
Sun, B. B., Chiou, J., Traylor, M., Benner, C., Hsu, Y.-H., Richardson, T. G., Surendran, P., Mahajan, A., Robins, C., Vasquez-Grinnell, S. G., Hou, L., Kvikstad, E. M., Burren, O. S., Davitte, J., Ferber, K. L., Gillies, C. E., Hedman, Å. K., Hu, S., Lin, T., … Whelan, C. D. (2023). Plasma proteomic associations with genetics and health in the UK Biobank. Nature , 622 (7982), 329–338. https://doi.org/10.1038/s41586-023-06592-6
Wang, R., Jansen, P., Côté, M.-A., & Ammanabrolu, P. (2022). ScienceWorld: Is your Agent Smarter than a 5th Grader? Proceedings of the 2022 Conference on Empirical Methods in Natural Language Processing , 11279–11298. https://doi.org/10.18653/v1/2022.emnlp-main.775
Wen, X., Liu, Z., Zheng, S., Ye, S., Wu, Z., Wang, Y., Xu, Z., Liang, X., Li, J., Miao, Z., Bian, J., & Yang, M. (2025). Reinforcement Learning with Verifiable Rewards Implicitly Incentivizes Correct Reasoning in Base LLMs (Version 2). arXiv. https://doi.org/10.48550/ARXIV.2506.14245
Xi, Z., Ding, Y., Chen, W., Hong, B., Guo, H., Wang, J., Guo, X., Yang, D., Liao, C., He, W., Gao, S., Chen, L., Zheng, R., Zou, Y., Gui, T., Zhang, Q., Qiu, X., Huang, X., Wu, Z., & Jiang, Y.-G. (2025). AgentGym: Evaluating and Training Large Language Model-based Agents across Diverse Environments. Proceedings of the 63rd Annual Meeting of the Association for Computational Linguistics (Volume 1: Long Papers) , 27914–27961. https://doi.org/10.18653/v1/2025.acl-long.1355
Xu, W., Luo, G., Meng, W., Zhai, X., Zheng, K., Wu, J., Li, Y., Xing, A., Li, J., Li, Z., Zheng, K., & Li, K. (2025). MRAgent: An LLM-based automated agent for causal knowledge discovery in disease via Mendelian randomization. Briefings in Bioinformatics , 26 (2), bbaf140. https://doi.org/10.1093/bib/bbaf140
Yang, J., Zhang, D., Song, X., Dai, Q., Liu, X., Chen, Y., Vashishtha, A., Shi, J., Tan, C., & Peng, H.
(2026). CausaLab: A Scalable Environment for Interactive Causal Discovery Toward AI Scientists. arXiv . https://doi.org/10.48550/arXiv.2605.26029
Yang, L., Wang, S., & Altman, R. B. (2023). POPDx: An automated framework for patient phenotyping across 392 246 individuals in the UK Biobank study. Journal of the American Medical Informatics Association , 30 (2), 245–255. https://doi.org/10.1093/jamia/ocac226
Yang, Z., Song, Z., Zabad, S., Legault, M.-A., & Li, Y. (2026). PheCode-guided multi-modal topic modeling of electronic health records improves disease incidence prediction and GWAS discovery from UK Biobank. Briefings in Bioinformatics , 27 (1), bbag030. https://doi.org/10.1093/bib/bbag030
Zhang, H. G., Eckmann, P., Miao, J., Mahon, A. B., & Zou, J. (2026). The Virtual Biotech: A multi-agent AI framework for therapeutic discovery and development. Science , eaeg6779. https://doi.org/10.1126/science.aeg6779
Zheng, J., Haberland, V., Baird, D., Walker, V., Haycock, P. C., Hurle, M. R., Gutteridge, A., Erola, P., Liu, Y., Luo, S., Robinson, J., Richardson, T. G., Staley, J. R., Elsworth, B., Burgess, S., Sun, B. B., Danesh, J., Runz, H., Maranville, J. C., … Gaunt, T. R. (2020). Phenome-wide Mendelian randomization mapping the influence of the plasma proteome on complex diseases. Nature Genetics , 52 (10), 1122–1131. https://doi.org/10.1038/s41588-020-0682-6
Zhou, Y., Wu, X., Huang, B., Wu, J., Feng, L., & Tan, K. C. (2024). CausalBench: A Comprehensive Benchmark for Causal Learning Capability of LLMs. arXiv . https://doi.org/10.48550/arXiv.2404.06349